How is housing policy climate policy? We modeled monthly household gasoline use across Virginia and set it side-by-side with local zoning data. Drag the divider to see how density and zoning forces longer drives.
We presented this work on a panel hosted by HousingForward Virginia, a statewide housing coalition, alongside NYU Furman Center's Housing Solutions Lab.
From messy spreadsheets to custom datasets built from scratch, we gather, build, and organize data across sectors, making it usable for insight, analysis, and policy decisions.
We build custom interactive maps, dashboards, and white-label applications that make complex information relevant for staff, stakeholders, and the public. Built with ease of use in mind
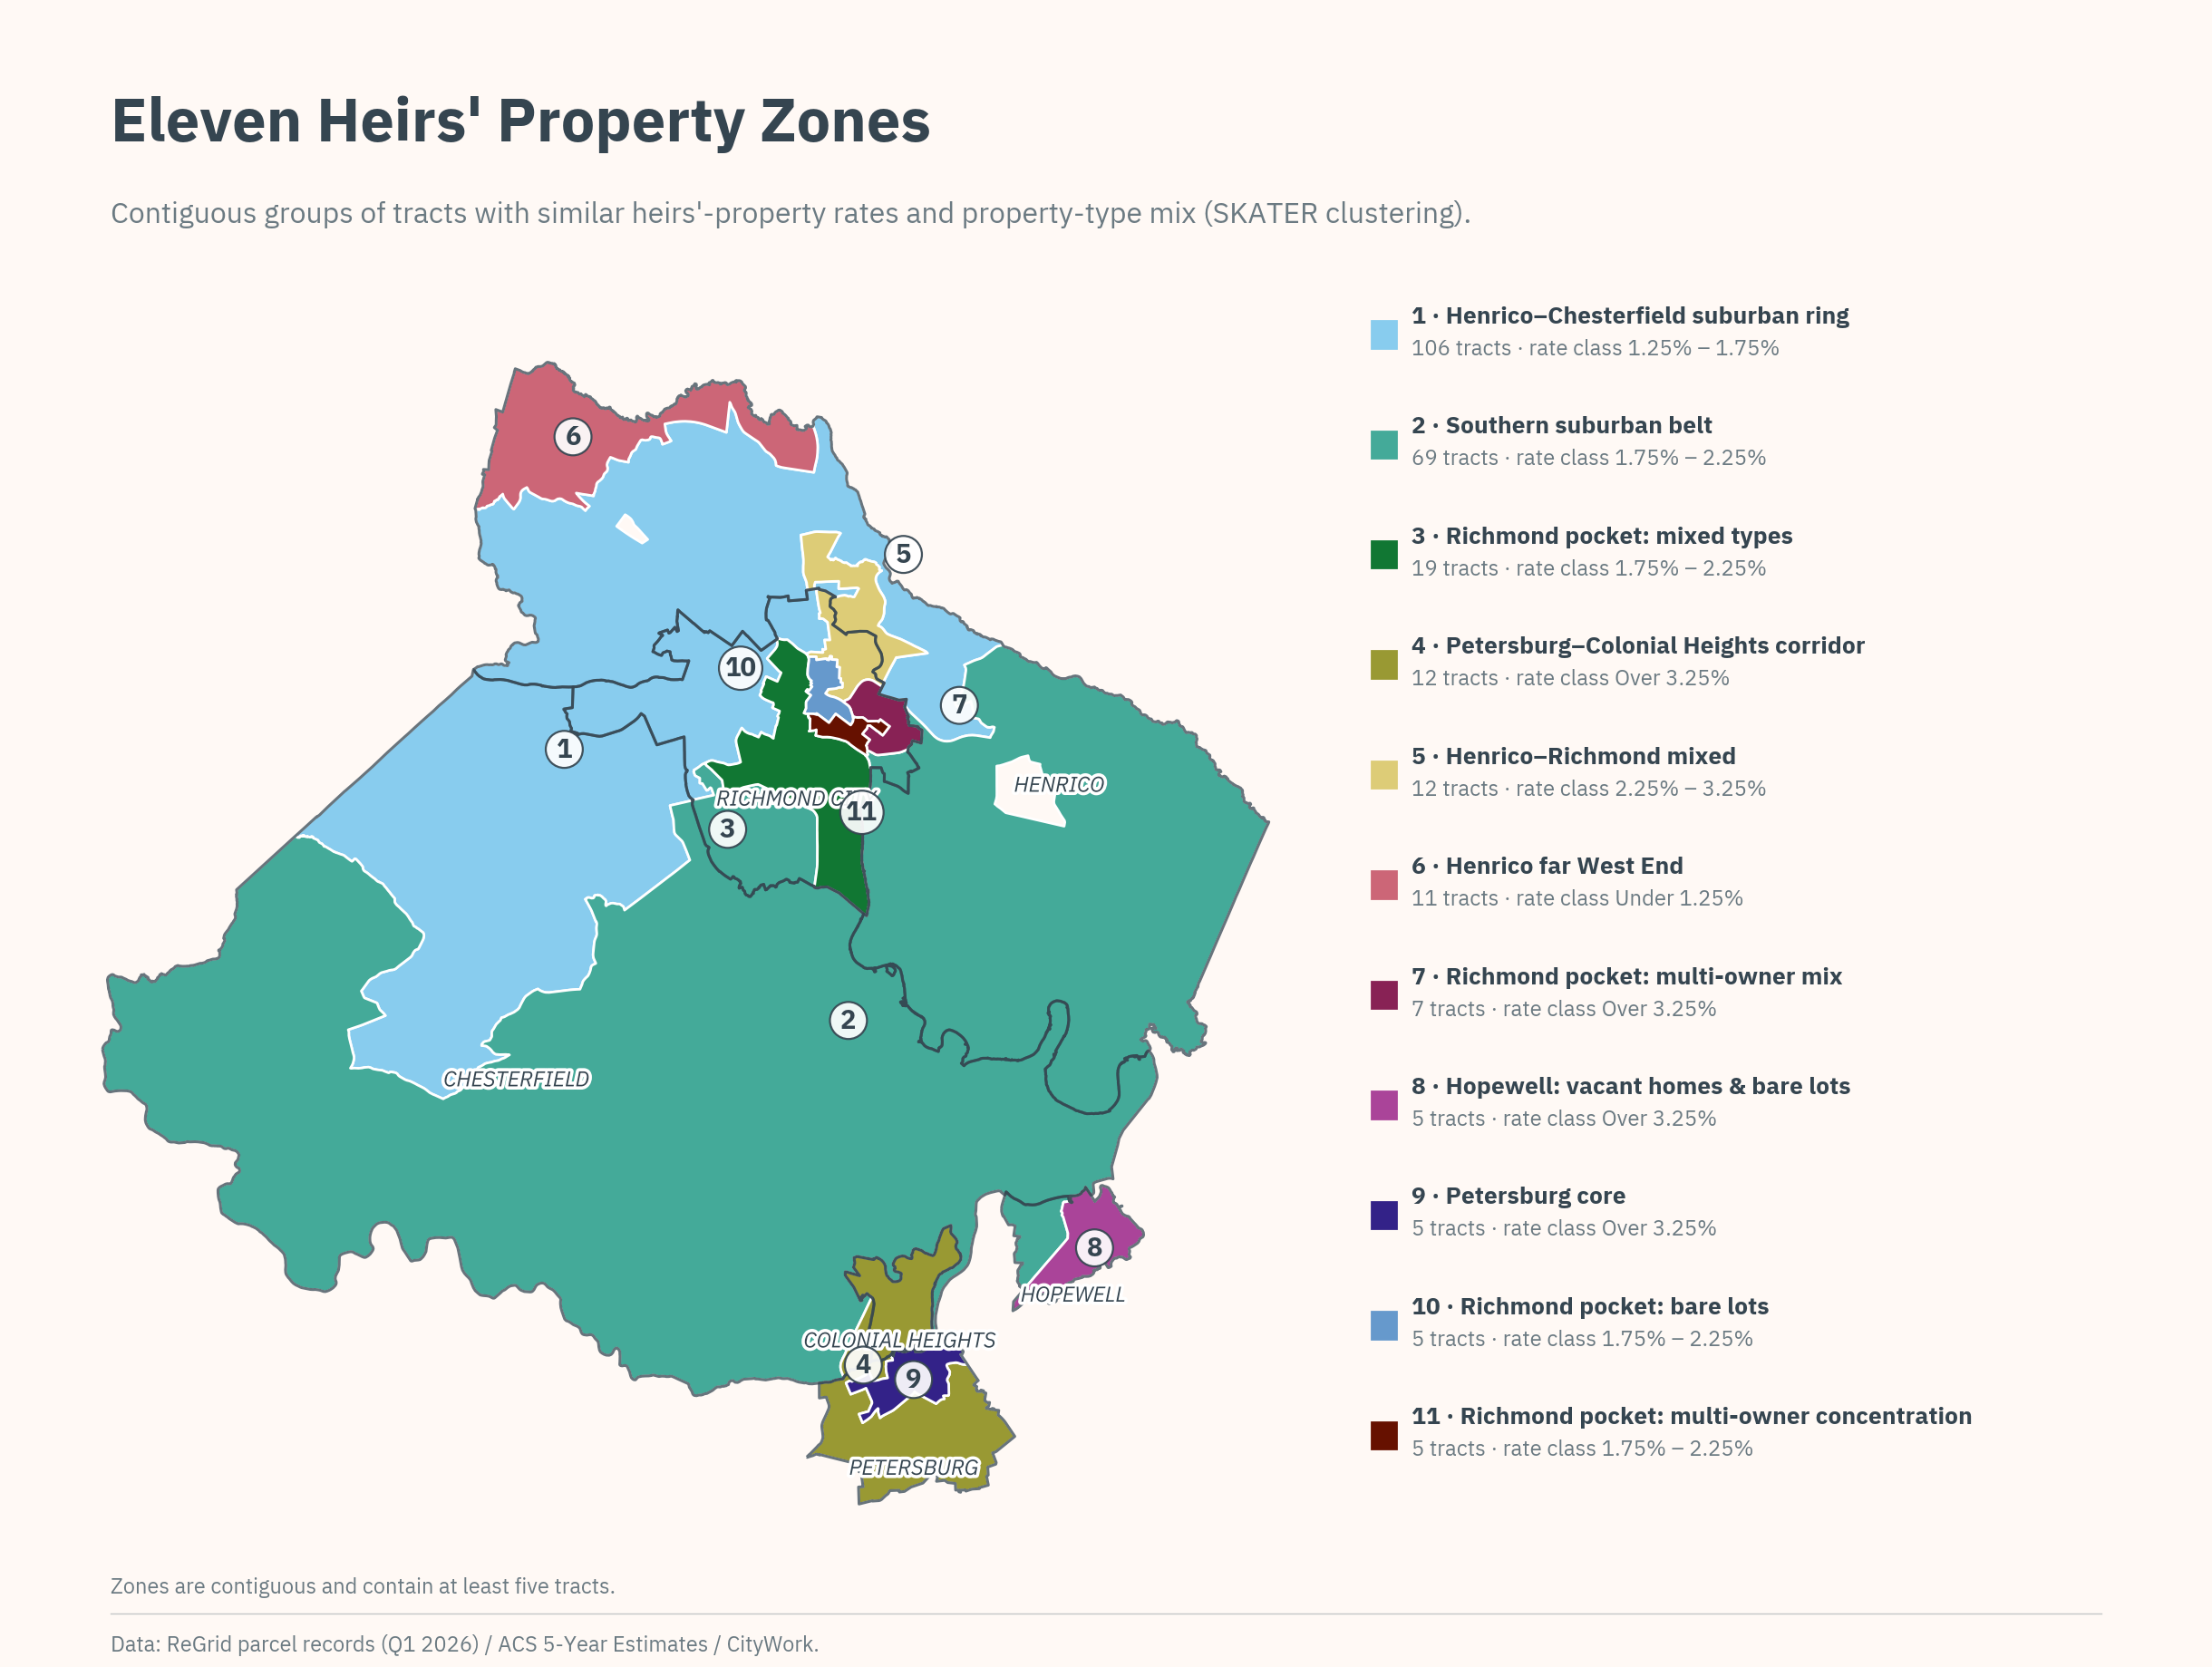
Measuring heirs property across the Richmond region, analyzing how many homes and parcels are at risk, what they're worth, and where they concentrate.
About the project →Research and mapping for Virginia delegate office, providing a county-by-county analysis of arrests and property seizures, along with practical steps to improve the law.
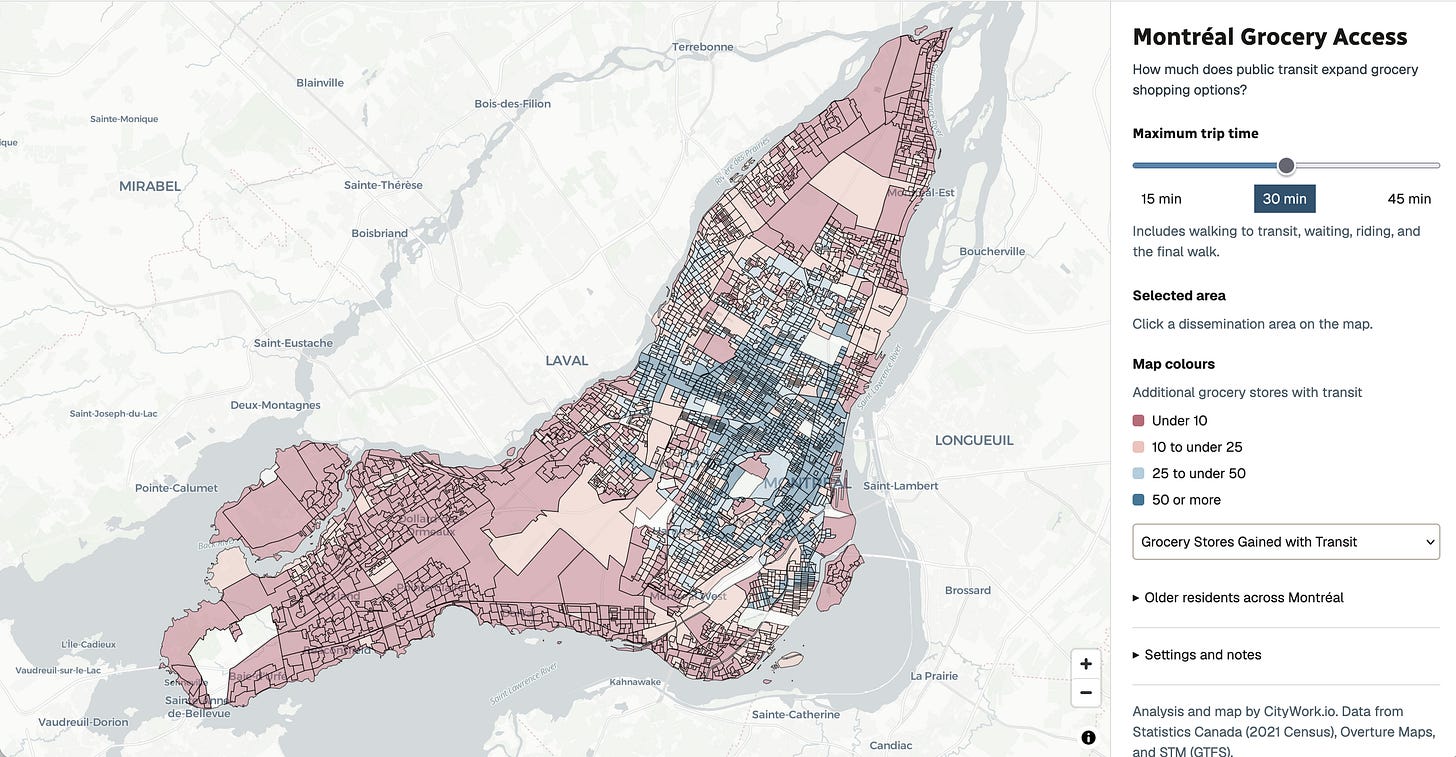
About the project →Interactive maps, dashboards, and white-label apps, built with the user in mind.
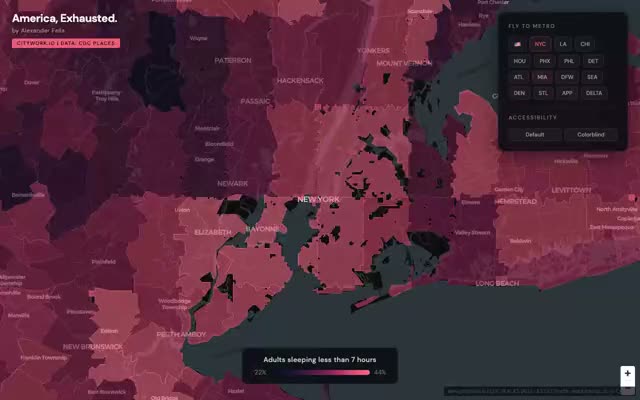
A new interactive map of sleeping habits across the country.
Open project → Economics, Transit, Workforce
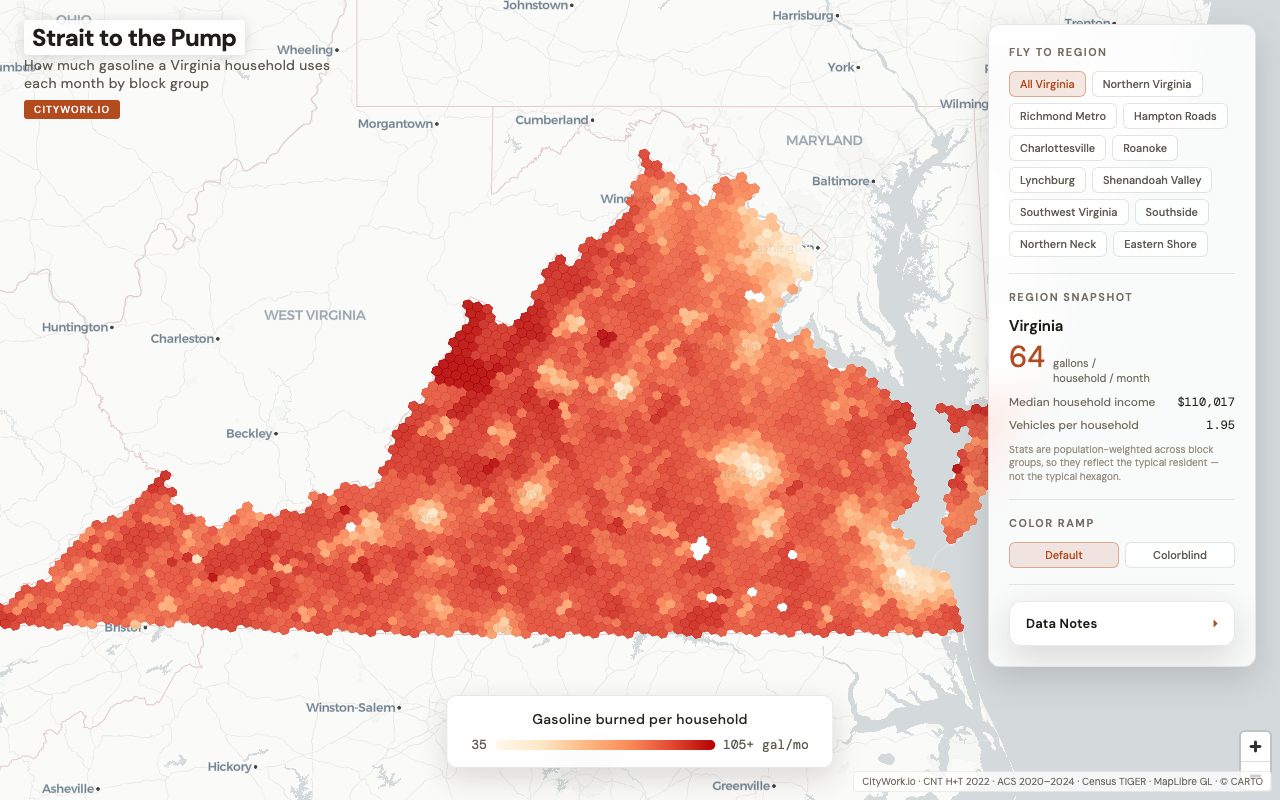
Who drives the most? And how do dual blockades on the Strait of Hormuz impact Virginia's workers?
Open project → Custom app
70+ public variables synthesized at the neighborhood scale, in one white-label web app.
Open project →Our founding question is “what does it mean to live well in the city together?”
Most of what's known about a city sits behind hefty paywalls, or requires technical expertise to use. Our research is free and public, our findings are built to empower communities to advocate for issues that matter most to them.
We ask hard questions about how cities work and who they work for, because we believe another city is possible.
From rent burden and housing supply, to evictions and who actually owns our homes, we track how housing's frontline challenges
Read the research →Cities face flooding, heat, fire, and storm-surge risk, but exposure isn't distributed equally. We make exposure and solutions legible for a more just future.
See the work →We turn economic data into insights on labor markets, commutes, wage gaps, production, and opportunity.
Work with us →From violence to overdoses to housing for older persons, we get at structural factors driving health disparities, and leverage duable solutions.
Work with us →We start with what you're trying to decide or change, then work backward to let evidence shape a question.
Working with data you already have, or setting out to find new sources, we gather, clean, or construct the data to support the project.
We give you maps, dashboards, white-label apps, and reports written for the people who have to use them- staff, boards, funders, the public.
Data can go bad and pipelines break. We keep tools updated, train your team, and stick around for follow-up questions.