Last week, CityWork launched a real-time map of rent prices in Norfolk. Thanks to your generous support, we’re continuing to build on that research. Below are three charts that capture a snapshot of renting in Norfolk. Each chart looks at rent and household income in six neighborhoods: Ocean View, East Ghent, Campostella Heights, Roland Park, Colonial Place, and Park Place/ Kensington.
These six neighborhoods are both the most expensive places to rent (right now) and have some of the highest rent to income gaps.
Click on the charts to zoom in.
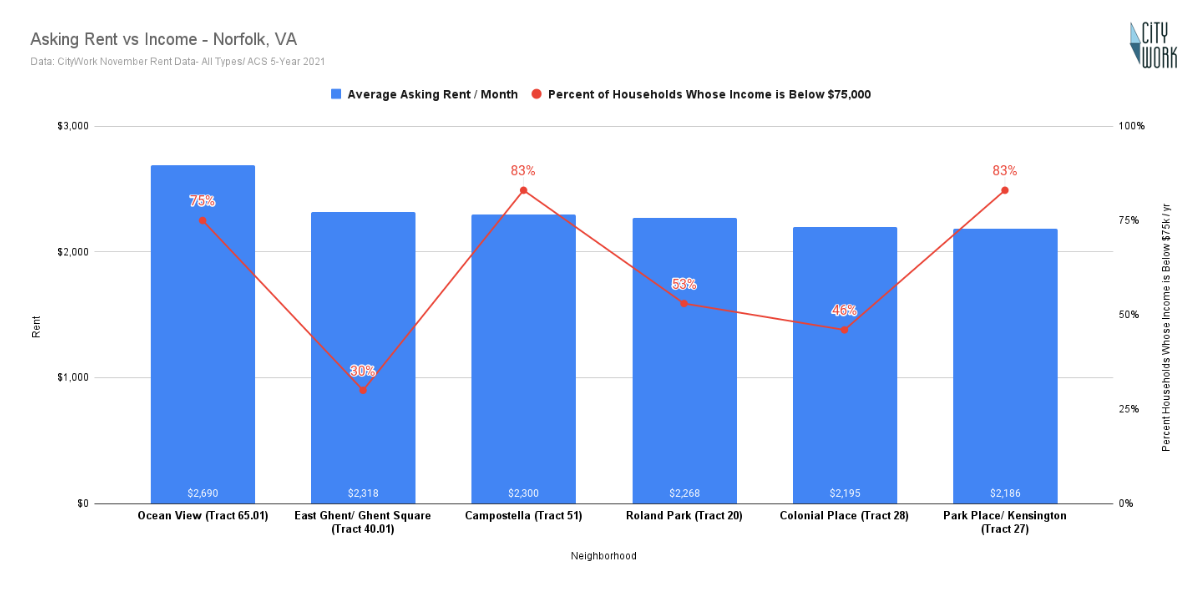
1. Income
In the neighborhoods where rents are highest, nearly a majority of households are making below $75,000 a year, with the exception of East Ghent/ Ghent Square.
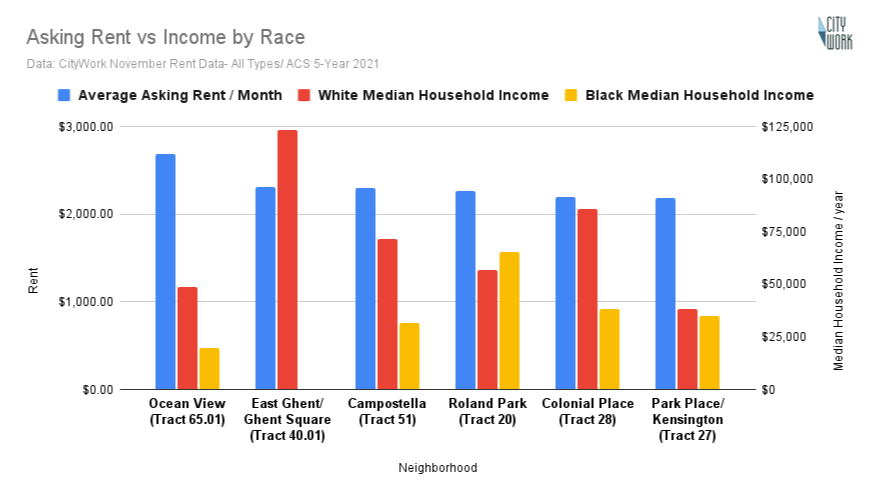
2. Race
The average asking rent in each neighborhood compared to median White household income and median Black household income. In the East Ghent/ Ghent Square neighborhood, there have not been enough Black households for the Census to calculate Black median income since 2016.
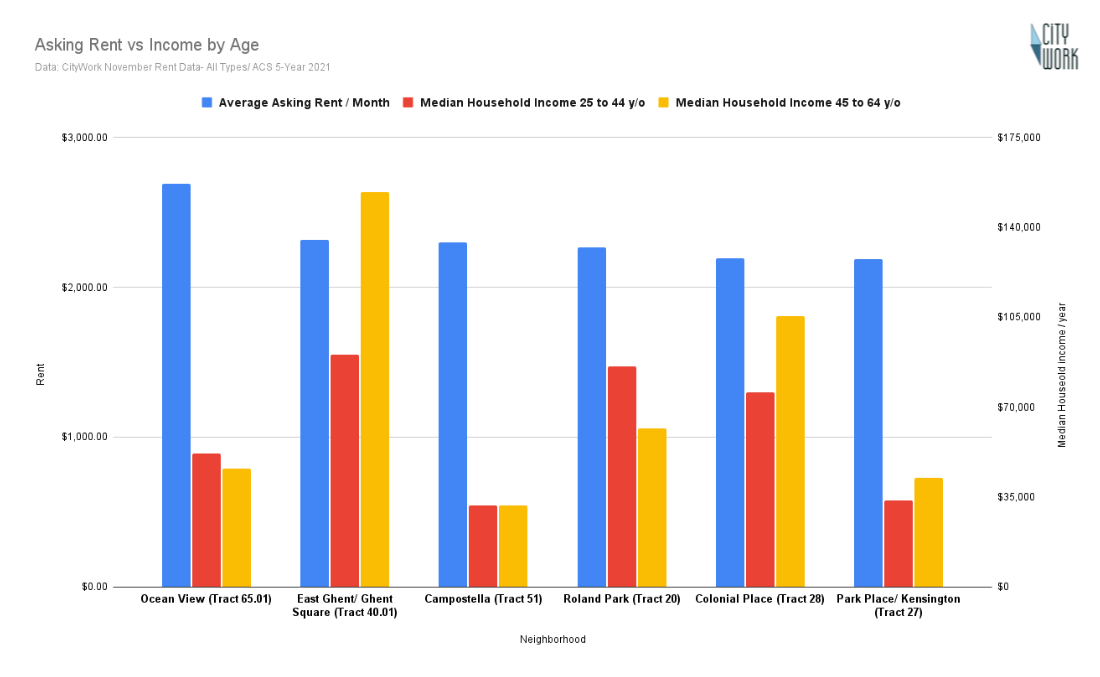
3. Age
In Ocean View and Roland Park, younger earners are making more than their older neighbors, but the margins are largest for older earners in East Ghent and Colonial Place.
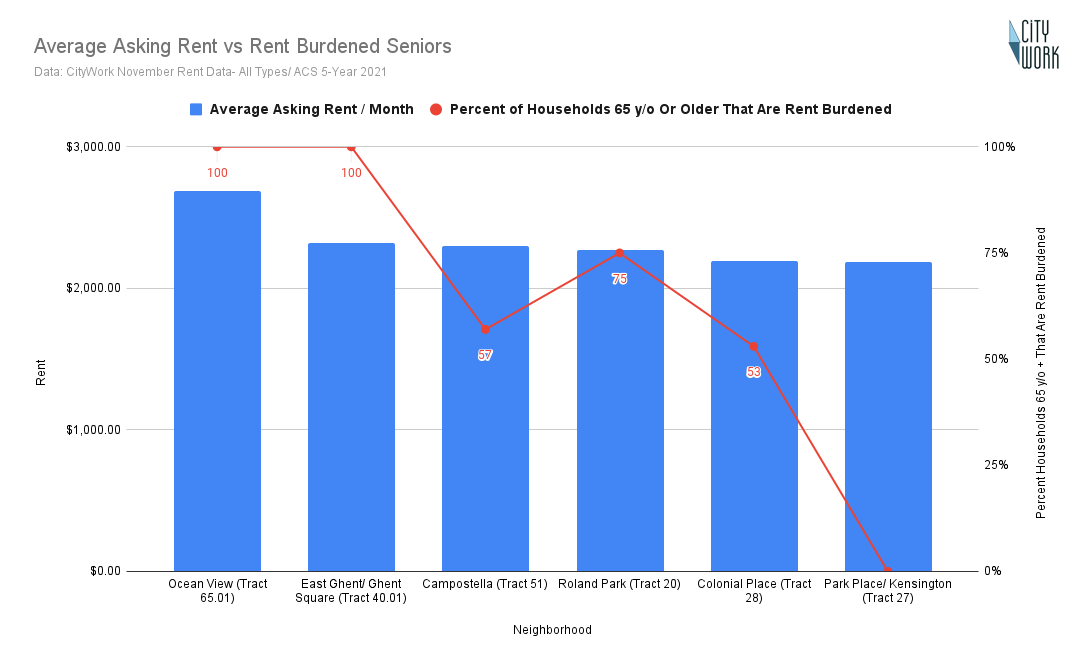
4. Seniors
According to the census, seniors are getting hit hard with high rents. In almost every neighborhood more than half of senior households that rent are rent burdened. Being rent burdened means spending at least 30% of income towards rent. In Ocean View and East Ghent/ Ghent Square, 100% of senior renter households are rent burdened. In Park Place, zero senior renter households are rent burdened. Zero and One-Hundred are unusual extremes for the Census, but even within the margin of error, the data signals a growing crisis of housing unaffordability for renters over 65 years old.
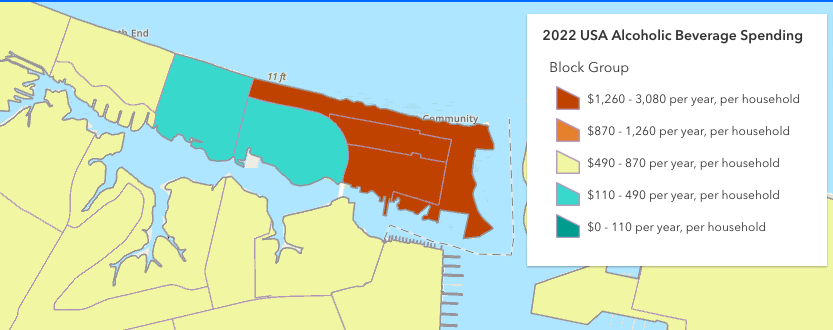
Bonus: Who's Got the Booziest Neighborhood in Norfolk?
East Ocean View. Residents there spend $1,425 a year per household on alcohol. The national average is $627 per household. Larchmont is a close second with $1,392 per household on alcohol.