The U.S. government shutdown has passed its thirtieth day, as the stalemate over what kind of country we want to be drags on. At the center of this standoff are the enhanced Affordable Care Act premium tax credits, set to expire at the end of the year. Originally introduced as emergency pandemic relief and later extended through the Inflation Reduction Act, these subsidies did two things: They increased assistance for people already using the marketplace and, crucially, extended eligibility to middle-income households previously shut out.
According to the Kaiser Family Foundation, Marketplace enrollment more than doubled, from 11 million people in 2020 to over 24 million in 2025. But the expansion was as fragile as it was successful, as enhanced subsidies expire at the end of this year. Millions will see their health insurance costs rise as a result.
To help make sense of this uneven geography of health care, CityWork mapped health care subsidies across the United States by ZIP code. The project visualizes where the enhanced tax credits are relied upon most, and supports communities and local governments to assess their own exposure, organize, and articulate concretely what’s at stake if (or when) subsidies expire.
1. What the Map Shows
The map shows how many residents in each ZIP code receive federal health insurance tax credits through the Affordable Care Act Marketplace. By clicking a ZIP code, you can view the number of residents receiving tax credits, the average monthly and yearly subsidy per enrollee, as well as the total annual tax credits flowing to that area.
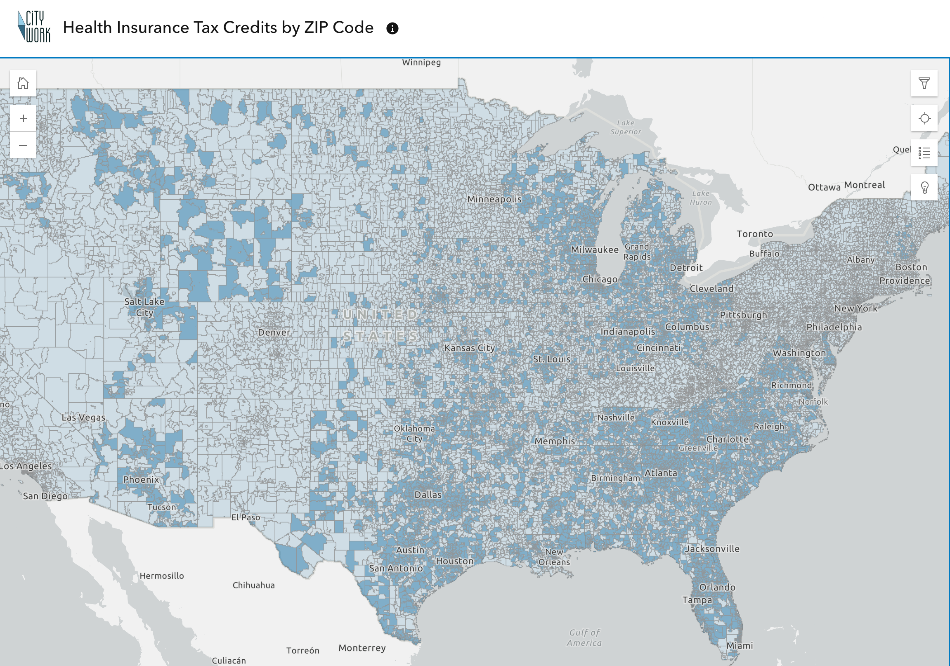
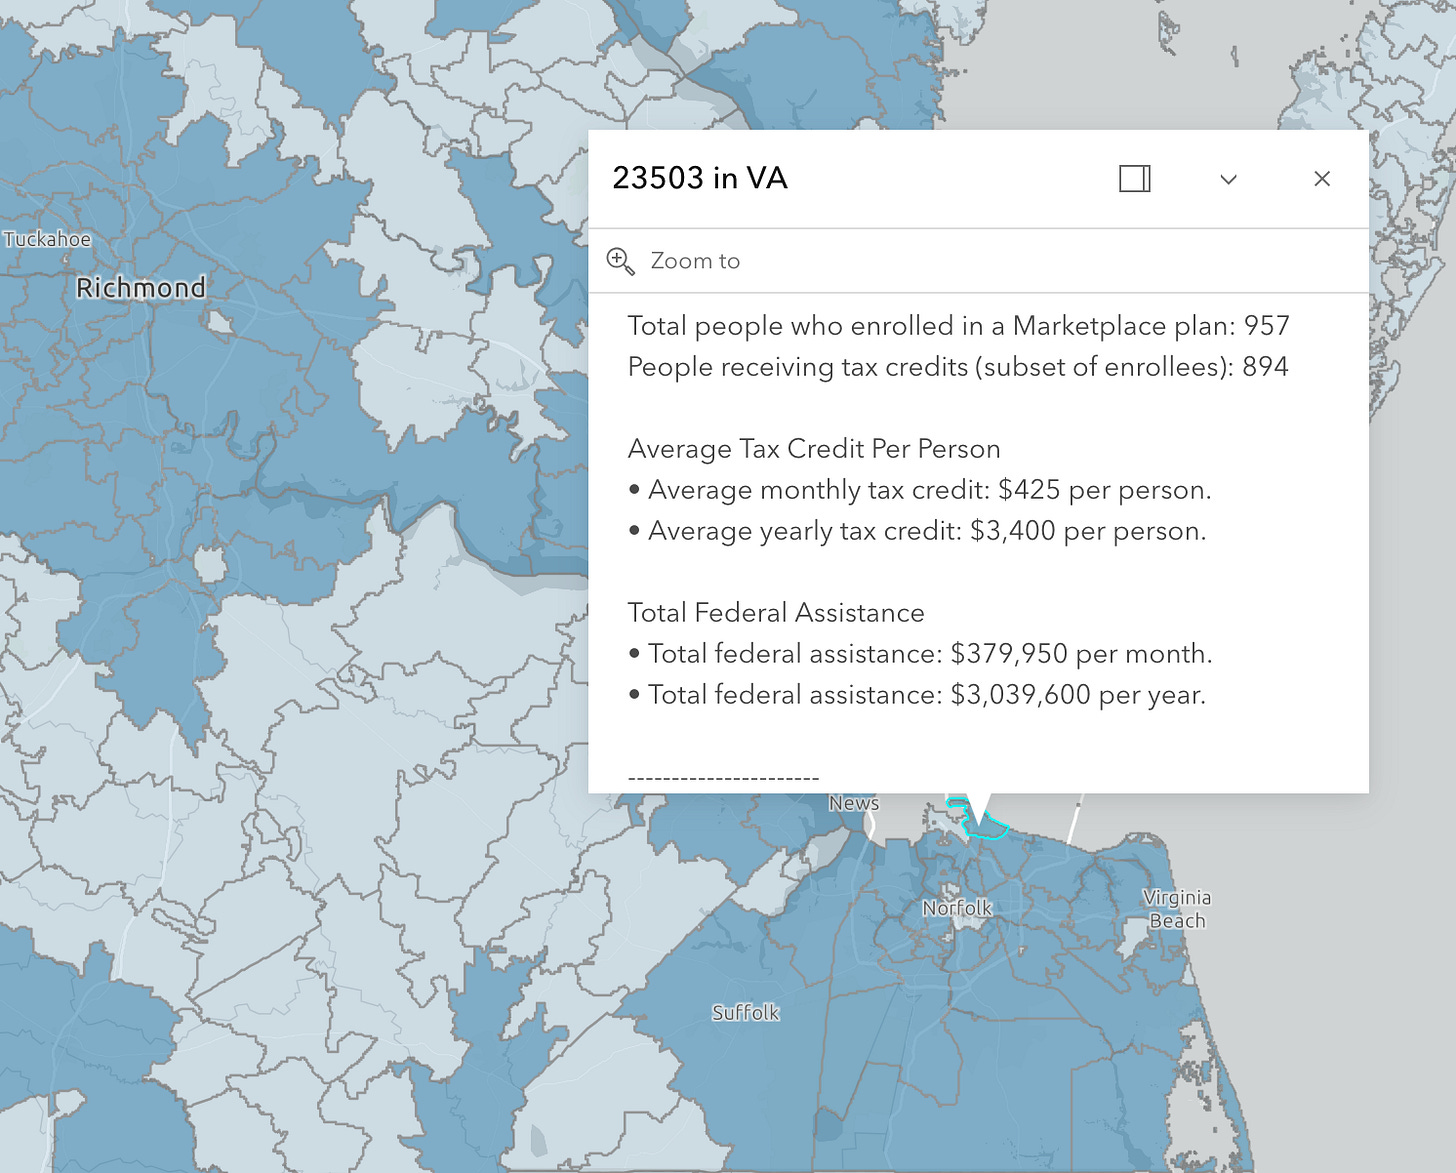
The geography of subsidies varies dramatically. West Virginia ZIP codes show particularly concentrated reliance. The five ZIPs with the highest average monthly subsidies, all exceeding $1,000 per enrollee, are located there, with enrollment ranging from 74 to 377 residents per ZIP. These communities face compounded vulnerability as substantial populations depend on these subsidies, and each enrollee requires significant federal support to afford coverage.
By contrast, the five ZIPs with the lowest average subsidies cluster in New Hampshire (with one outlier in Fauquier County, Virginia), where roughly 20 enrollees per ZIP receive around $250 monthly. The minimal enrollment suggests either alternative coverage sources, like employer insurance, Medicaid, or sparse population density limiting marketplace uptake altogether.
2. Why Are Some ZIPs Missing?
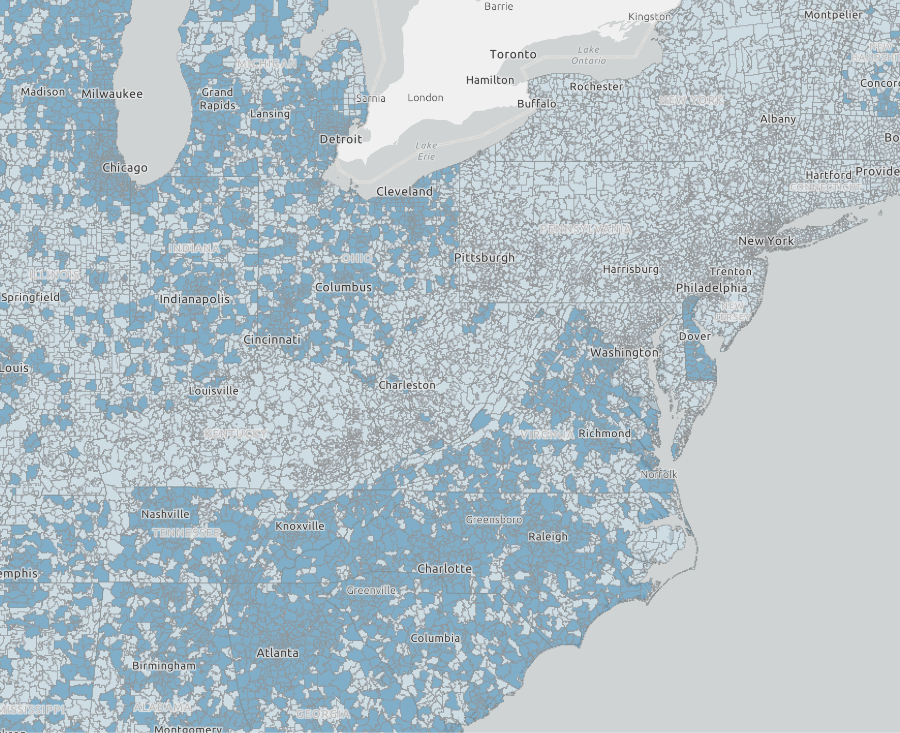
The map uses Federal CMS Public Use File data, which only covers the states that used the federal marketplace for enrollment in 2023. Some states run their own marketplaces and maintain separate datasets not included in federal reporting. Virginia appears here because 2023 was its final year in federal data before switching to a fully state-based exchange.
Additionally, many ZIP codes show up blank not because residents lack coverage, but because federal data suppresses counts below certain thresholds to protect enrollee privacy.
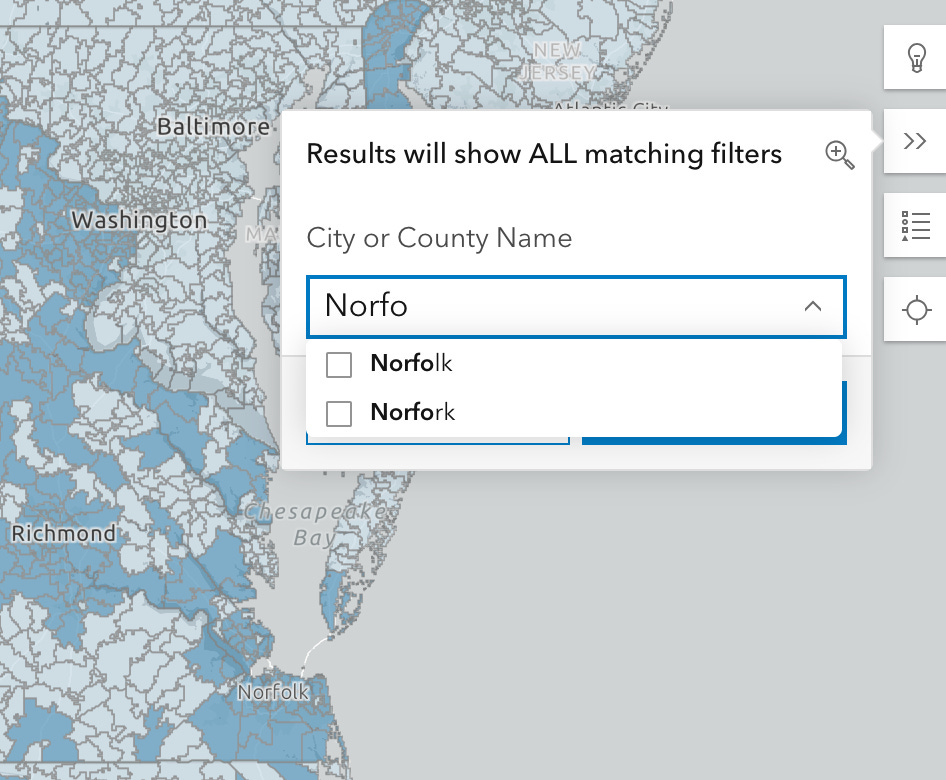
You can search and filter by city and county name.
3. How’d You Arrive at the Annual Subsidy Amounts?
Monthly subsidy amounts come directly from CMS public use files and represent the average Advanced Premium Tax Credit (APTC) among consumers who selected Marketplace plans and received subsidies during the 2023 Open Enrollment Period.
The annual figures take a bit more care. Simply multiplying by twelve months would overstate federal spending, since not everyone stays enrolled the entire year; people gain employer coverage, move, or switch plans mid-year.
We used an eight-month coverage window per enrollee, based on a weighted analysis of CMS’s 2023 issuer-level data covering 3.8 million effectuated policies in order to better reflect real world enrollment.
That eight-month multiplier offers a more realistic upper-bound estimate of federal spending than assuming a full year of continuous enrollment. It’s also consistent with Stanford and NBER research on ACA early exits (Diamond et al., 2018) and with CMS’s own metrics on enrollment duration.
Free research. No sign up. No pay wall. Please support us by sharing this work