That life-quickening atmosphere of a big railway station where everything is something trembling on the brink of something else.
Vladimir Nabokov, Spring in Fialta and other stories (1956)
If you’re like me, pronouncing the objective good of mass mobility often comes with a private yearning for the air conditioned isolation only four wheels and a six lane can provide. But for most people who can’t drive, or would rather be anywhere than behind the wheel, public transit can expand access to all a city has to offer.
That’s at least according to the theory of transit-oriented development, or TOD, an approach to planning that tethers housing, shops, and services to public transit.1 The thinking is sound enough. A housing development with useful connections should let residents reach more of the places they need within a reasonable time, while reducing the need to get into a car for every trip.
For older residents, or people with limited mobility, a bus stop next to their home might look like all that’s needed to accomplish this. But having a bus stop nearby and having somewhere useful to take it are not quite the same thing. A bus stop near your home sounds useful, but only if it takes you somewhere useful.
Take grocery shopping for example. About 75,000 Montréalers aged 65 and older live in blocks where fewer than five grocery stores are reachable within a half-hour walk. Public transit should help expand those options. So one way to measure a bus’ usefulness is to ask: within the same half hour, how many more food shops can someone reach with transit than by walking?
Enter City2Graph, a new library that turns geographic data into connected networks.2 Think of street junctions as points and the walkable street segments between them as lines. Connecting starting points, grocery stores, and transit stops to that network makes it possible to trace routes between them. Combined with public transit schedules, the network lets us count which shops someone could reach after walking to a stop, waiting, riding, and walking the final stretch.3
Below, I use that network to map out walking and transit access across 3,213 small census blocks in Montréal, called Dissemination Areas (DAs), alongside public transit schedules. The question is, for older Montréalers in particular, how many more shops does transit put within reach, and are those gains shared evenly across the island?
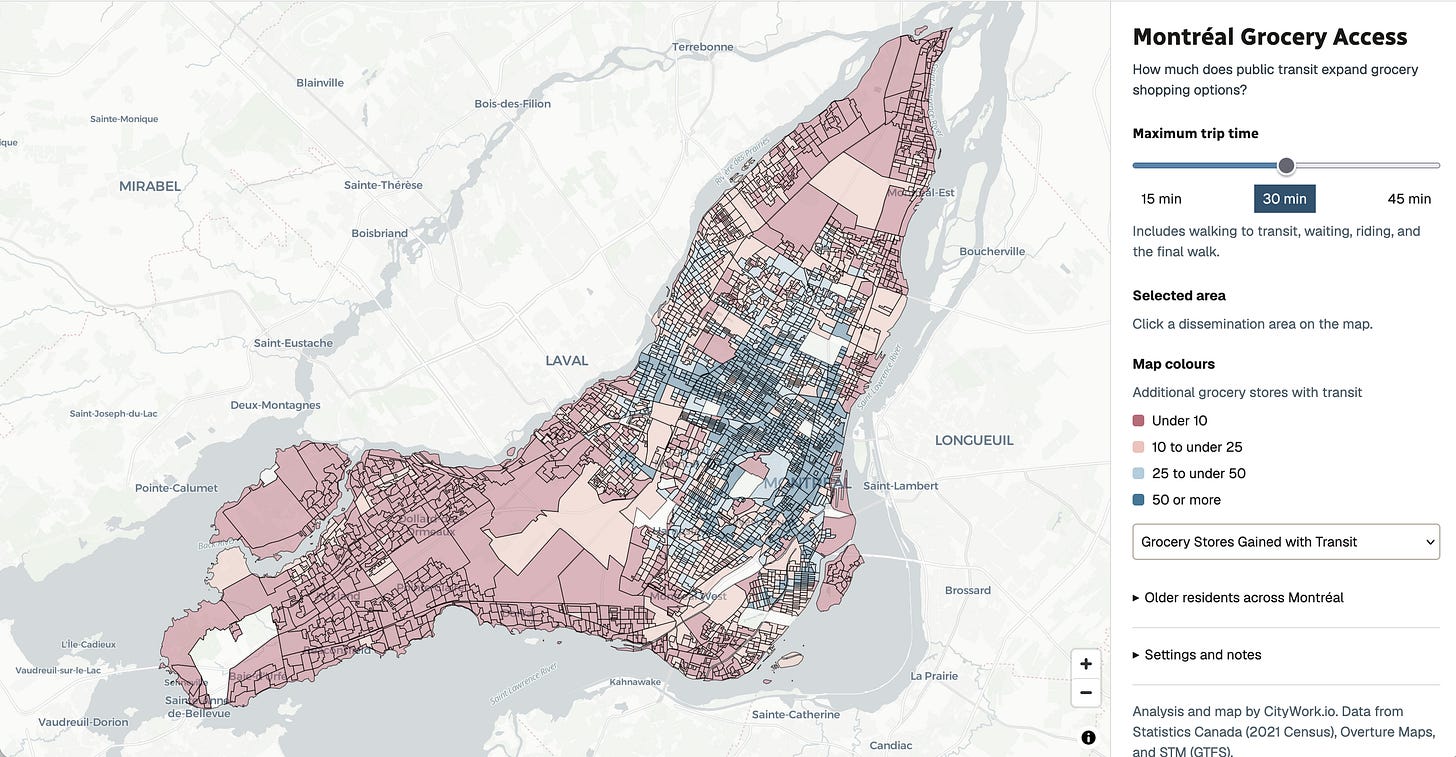
Transit expands grocery choice substantially
Across Montréal’s blocks, an average of about 21 food shops are reachable on foot within 30 minutes.4 That includes grocery stores as well as specialty shops like fruiteries, butchers, and fishmongers.
With public transit available, one DA can reach, on average, 51 food shops. So transit adds an average of 30 food shopping options per DA within the same travel time. When it comes to grocery shopping, transit greatly expands accessibility to different stores.
But 30 is only the average. The median area gains about 19 shops. A smaller number of very large gains- especially in the city’s dense urban core- pulls the average upward.
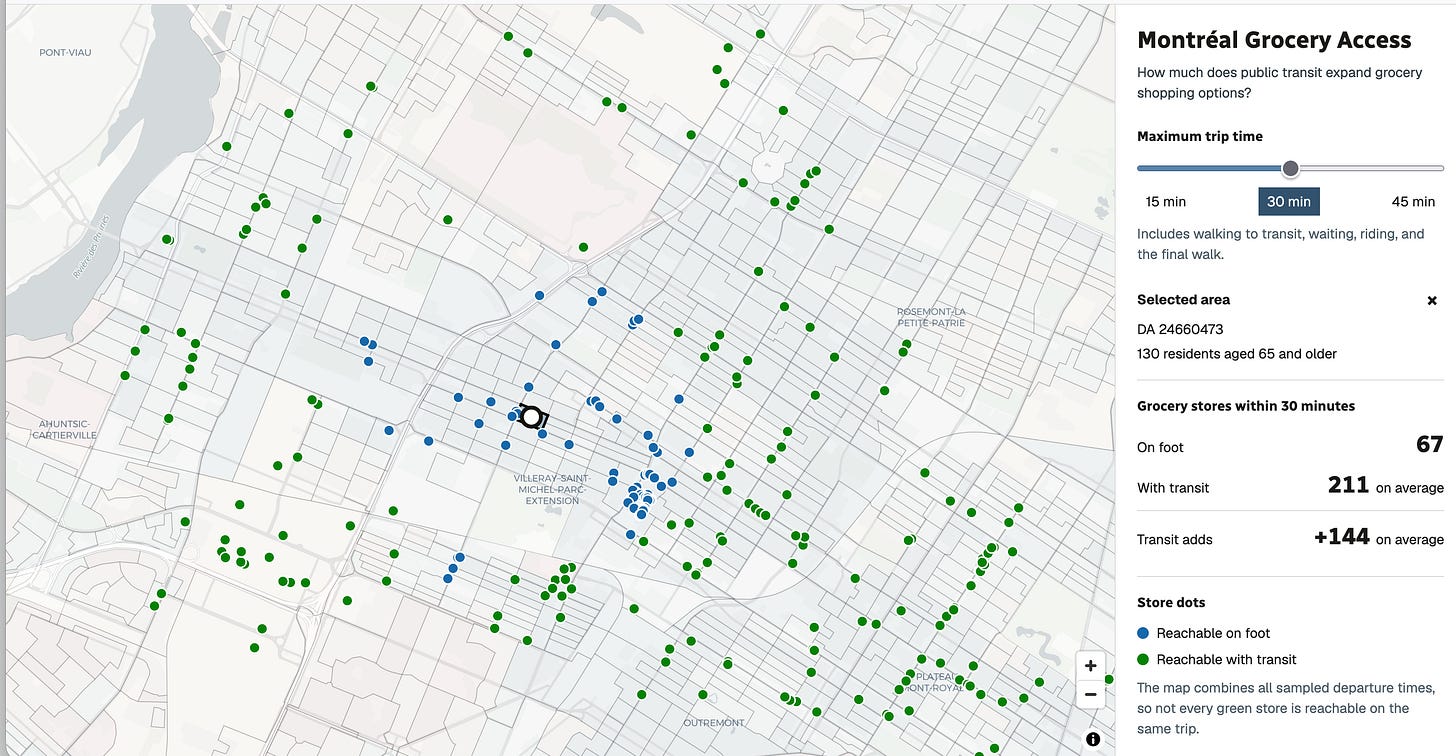
For example, near Jarry and Saint Hubert, in Villeray, one block reaches 67 grocery stores within 30 minutes on foot. But with transit available, the count averages up to about 211 stores, a gain of 144.
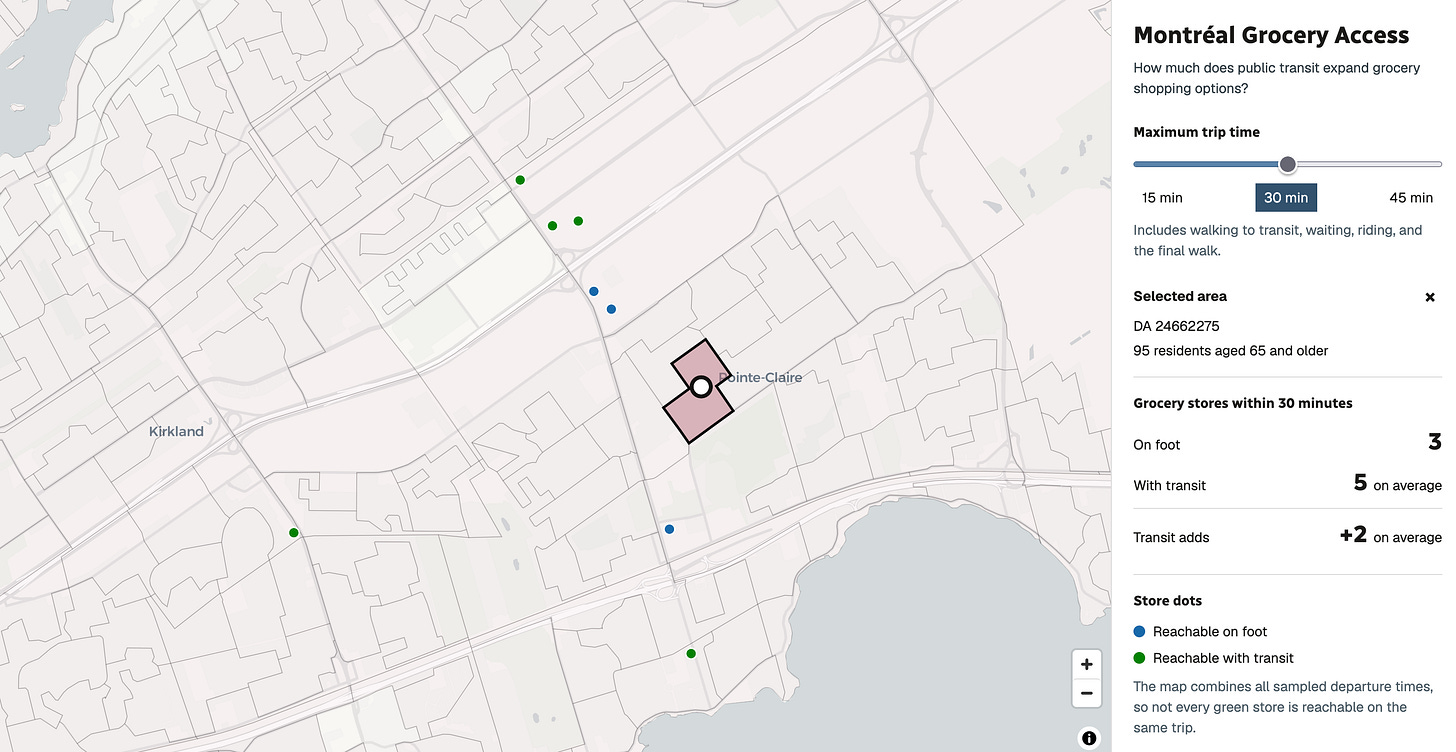
Compare this to a block in Pointe-Claire where three grocers are reachable on foot within 30 minutes. With transit, that rises to about five, a gain of just two stores.
Public transit gains are uneven for older residents
To understand what the results mean for older residents, we also need to account for how many people aged 65 and older live in each block.
When we weight each block by how many residents aged 65 and older live there, the picture shifts slightly. The average older Montréaler lives in an area where transit adds about 27 grocery stores. The median older Montréaler lives in an area gaining about 16.
Put another way, half of Montréal’s older residents live in places where transit adds roughly 16 shops or fewer within the same half hour. That’s what this chart below shows.
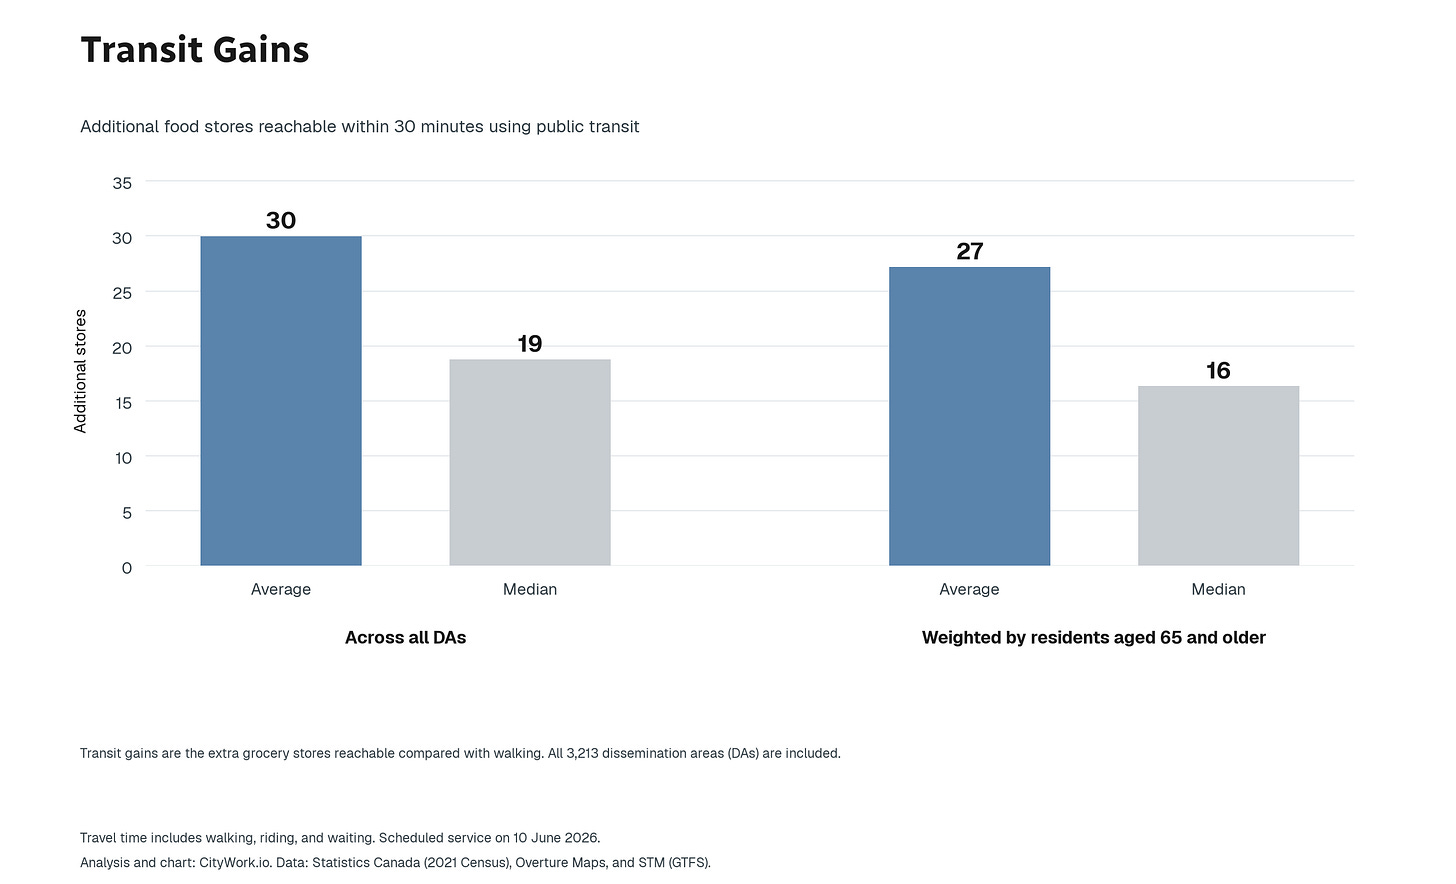
Half of Montréal’s older residents live in places where transit adds roughly 16 shops or fewer within the same half hour.
Mind the gap
While transit does expand grocery access for older residents overall, the harder question is whether it narrows the gap between places that had limited grocery access to begin with or simply gives a boost to already well-served areas.
One way to measure that is by testing how uneven grocery access is across the areas where older residents live, first on foot and then with transit. If public transit were narrowing the gap between blocks, we would expect grocery access across those areas to become noticeably more even.
But in Montréal, it doesn’t.
Transit increases the number of shops older residents can reach, but it does not meaningfully narrow the gap between areas that already had strong grocery access and those that didn’t
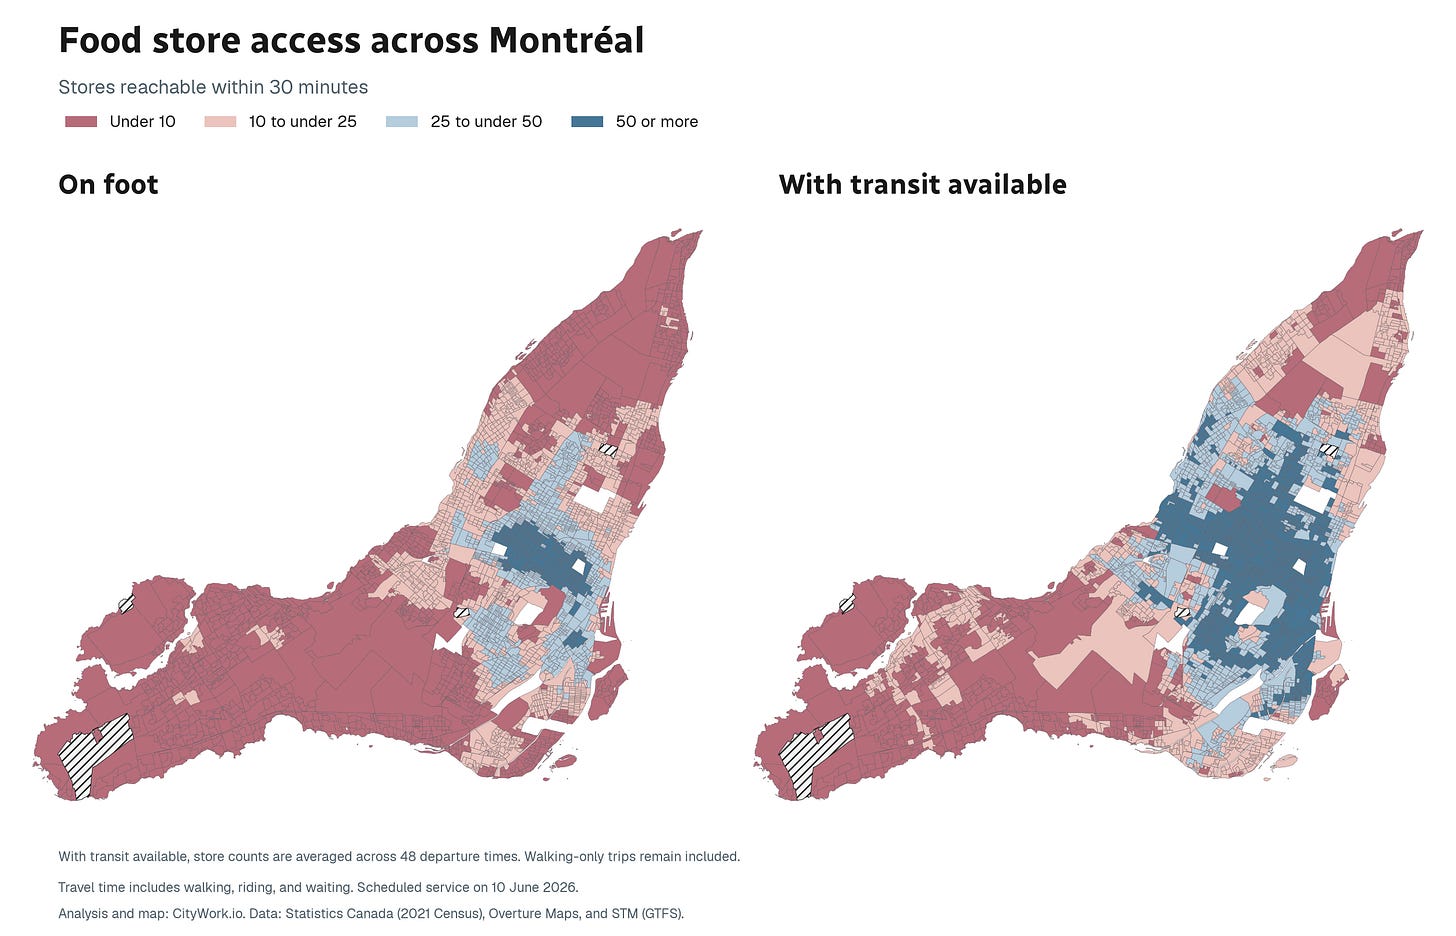
The maps below make that easier to see. With transit, many central areas, already well supplied with grocers, move even further into higher-access bands.
But large stretches toward the island’s ends remain in the lowest access band, with fewer than ten food shops reachable within 30 minutes, even with public transit. To be sure, those places do gain access to grocery shops, just not enough to catch up.5
Transit adds more grocery options where walking access is already strong
When it comes to grocery shopping, transit gains follow a clear geographic pattern.
In the areas that consistently see the smallest transit gains, walking reaches about five shops within 30 minutes, and transit adds only about four more grocery stores.
Blocks with the smallest gains are home to 82,460 older residents, nearly 25% of Montréal’s older population.
At the other extreme, the areas with the biggest transit gains already have much stronger access on foot. There, walking reaches about 45 shops within 30 minutes, and transit adds another 98. These areas are home to just 30,780 of the city’s older residents, about 9% of the city’s older population.
Ultimately, when it comes to how well public transit expands grocery access, the largest benefits tend to appear where grocery access was already strongest, with less benefit to Montréal’s senior population.
The chart below shows the relationship between walking access and the extra grocery stores transit puts within reach. The horizontal axis shows how many stores can already be reached on foot; the vertical axis shows how many additional stores become reachable with transit. Each square groups areas with similar levels of access. The darker the square, the more residents aged 65 and older live in those blocks.
Read from left to right, the pattern becomes clear. Places with few grocery stores within walking distance also tend to gain relatively few additional stores from transit. The largest transit gains are concentrated farther to the right, in places where walking access was already stronger. The darkest concentration sits toward the lower left, with many older residents living in areas where relatively few stores are reachable on foot and transit adds relatively few more.
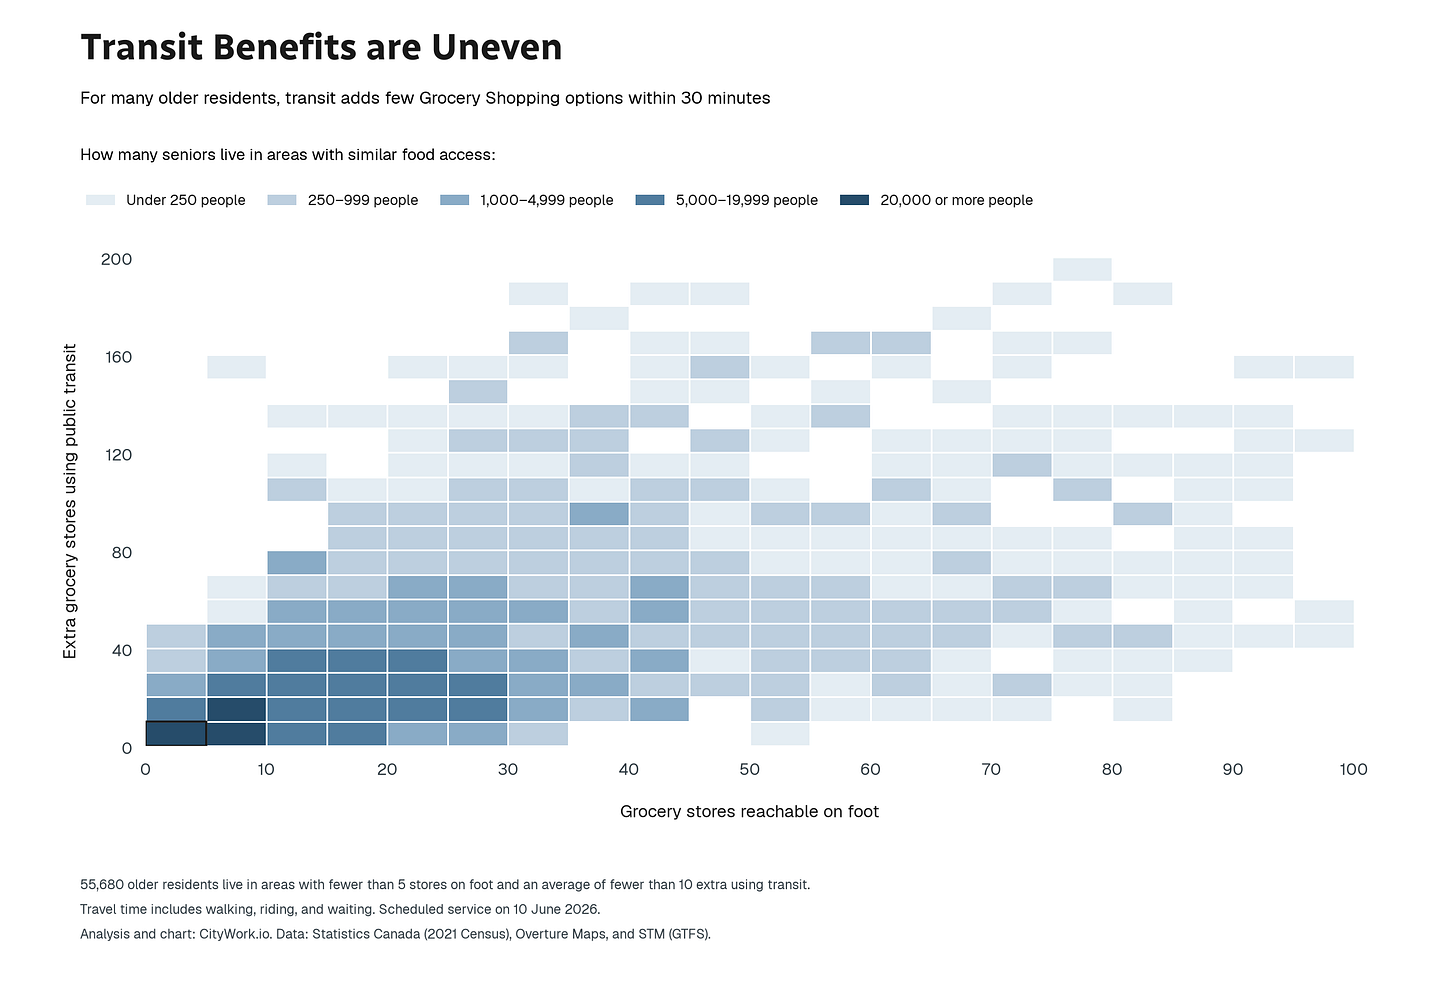
When it comes to how well public transit expands grocery access, the largest benefits tend to appear where grocery access was already strongest. And with less benefit to Montréal’s senior population.
The map below shows where the island’s two extremes of access are concentrated. Red areas are places where transit consistently adds only a few grocery options— about four stores on average. Blue areas are places where transit adds about 98 additional grocery options on average. Grey zones fall outside these two extremes.
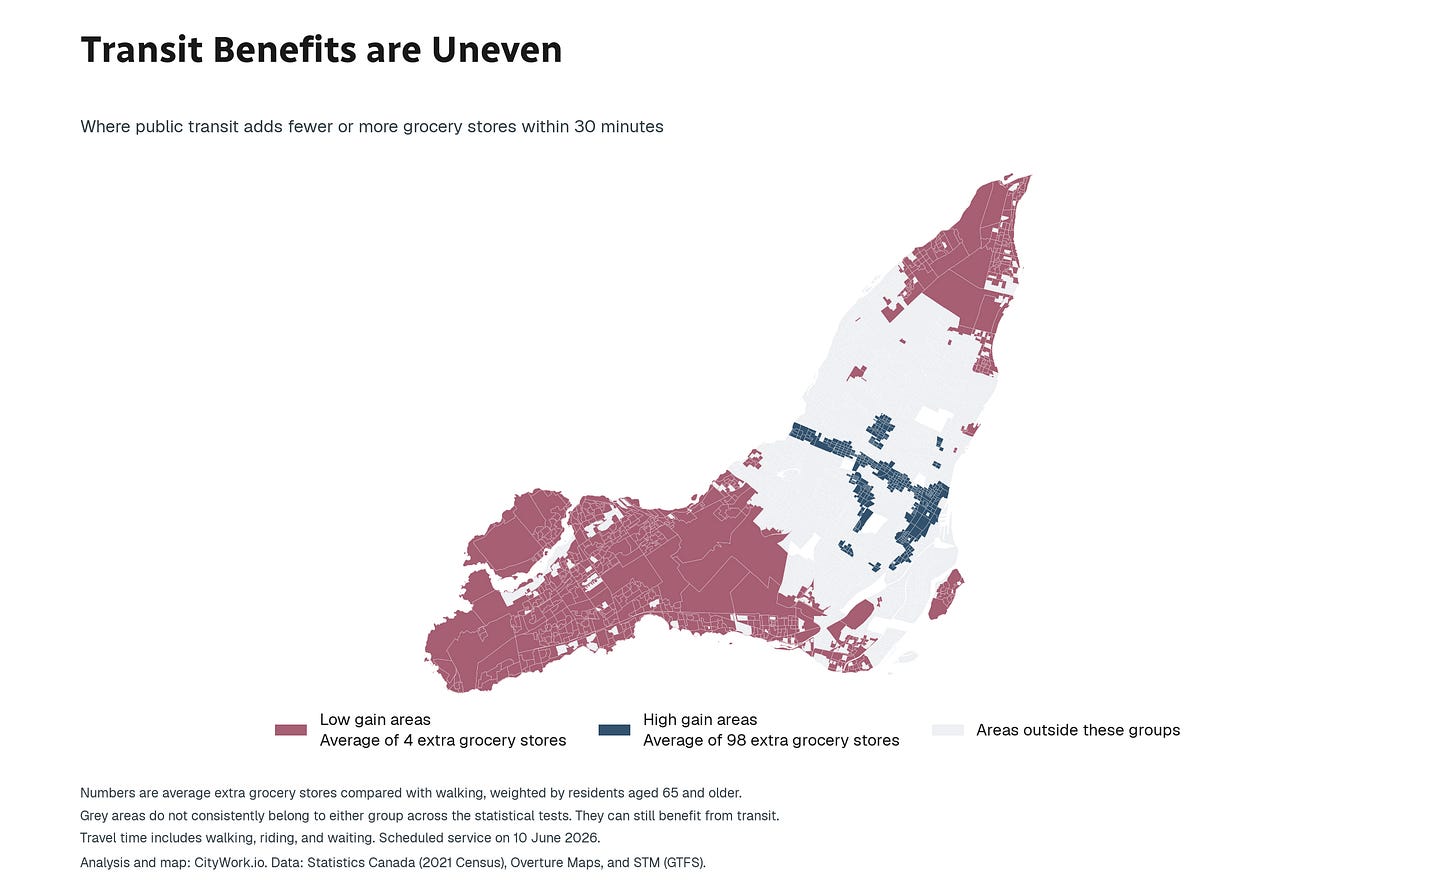
Among these extremes, the areas where transit adds only a few grocery options contain more than twice as many older residents as the areas where it adds the most. Granted, most older Montréalers live outside either group, but among the clearest extremes, far more live where transit adds relatively little by way of grocery stores.
What’s behind the uneven gains?
One might well ask “isn’t this unevenness just because the dense urban core has more transit options?” Partly.
Comparing ten blocks at either extremes- five populous areas where transit adds relatively few grocery options, and five where it adds many- offers some insight into what’s driving this pattern.
The places with the largest gains generally have both more transit service and more grocery stores nearby. Across these ten areas, the blocks which gain the most have roughly three times as many opportunities to board public transit within 15 minutes, and nearly three times as many grocery stores within three kilometers.
Intuitively, that makes sense. Public transit can only connect people to stores that exist, and areas with more frequent or overlapping service offer more chances to reach them within a half hour window.
But neither factor tells the whole story. In one low-gain block, residents often have difficulty boarding transit quickly at all. In another, transit is readily available, yet it adds only three grocery options within 30 minutes.
The broader takeaway here, for Montréal and any city, is that proximity to transit is not the same thing as access. For something as ordinary as grocery shopping, what matters is how much service is available, where it goes, how many destinations it connects to, and whether the whole journey fits inside the time someone has.
Notes and methods
- See Bertolini, Curtis and Renne (2009, pp. 3–5), “Introduction,” in Transit Oriented Development; cf. Gottlieb and Ng (2017, pp. 165–204), “Transportation in the City,” in Global Cities. ↩
- Sato, Y., Pietrostefani, E., Mahabir, R., & Arribas-Bel, D. (2026). City2Graph: A Python library for Heterogeneous Graph Neural Networks and spatial analysis in urban systems. Computers, Environment and Urban Systems, 130, 102492. https://doi.org/10.1016/j.compenvurbsys.2026.102492 ↩
- The analysis covers 15, 30, and 45-minute trips; this report focuses on a 30 minute window. It includes 1,241 food shops (large grocery stores, fruiteries, butchers, and fishmongers) each counted as a possible destination. Access was calculated from Statistics Canada’s centroids in Montréal. Travel time includes walking, waiting, riding, and transfers, with walking modeled at one meter per second. Transit results are averages across 48 departures, sampled every five minutes from 11 a.m. to 12:55 p.m. and 4 p.m. to 5:55 p.m. on 10 June 2026. Mobility assumptions will not fit every older resident. ↩
- For the sake of brevity, I focus on a 30 minute journey time here. Admittedly, thirty minutes is arbitrary. The map visualizes 15, 30, and 45. I focus on 30 because that’s about how long my Montréal metro commute typically lasts before I start thinking gas prices might be worth it. ↩
- To quantify this, I used a Gini coefficient, which measures how unevenly grocery access is distributed across the island, weighted by where residents aged 65 and older live. A score of 0 would mean equal access. Higher scores indicate greater differences between areas. In Montréal, the coefficient barely changes (from 0.493 on foot to 0.491 with transit). which indicates persistent uneven access. ↩