“The closest thing we have to a secretary of state outside government,” Bob McNally once said, “is the CEO of Exxon.” Over the past couple months, oil is back at the helm of American foreign policy.
Roughly a fifth of the world’s crude oil moves through a 21-mile strait between Iran and Oman known as the Strait of Hormuz. Currently, dual blockades and an on-again-off-again war have sent oil prices surging, causing gas prices to rise as well. In Virginia, the average price of gas currently sits around $4.25 a gallon, up around 42% from this time a year ago.
While the impact of a slow-burning oil shortage and the prospect of digging even deeper to afford life’s basics is bruising at best, it raises a more local question. How does gas consumption break down across the state? And who’s feeling the uneven economic impact as shipping in the strait stalls?
To answer that, I’ve launched a new interactive map of Virginia’s gas-guzzling habits: Strait to the Pump
1. 64 gallons a month.
This map shows estimated monthly gasoline consumption per household across Virginia.
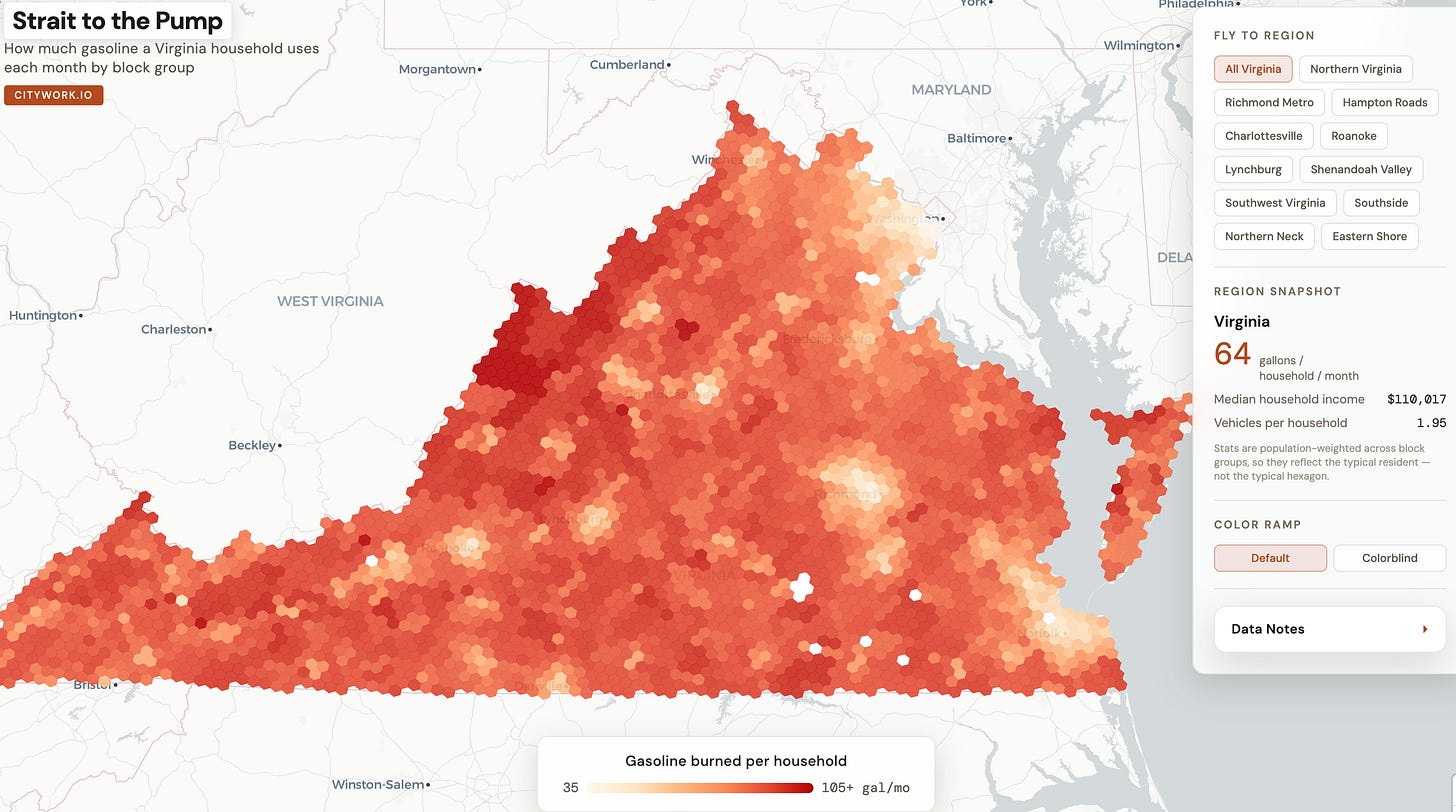
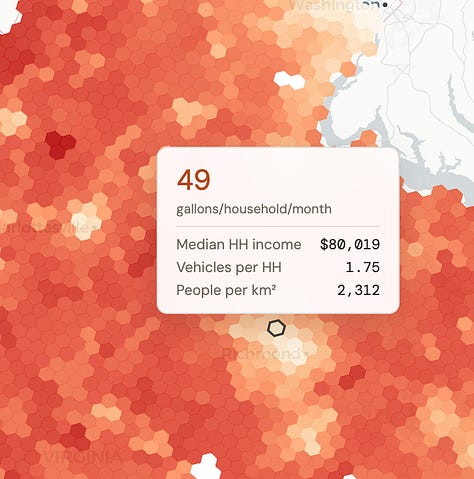
The typical Virginia household burns around 64 gallons of gasoline a month. Last year, that household would have spent roughly $2,283 annually on gas. Today, that same household is paying $3,244 a year.
If gas prices stay where they’re at now, the typical household is looking at spending an extra $961 per year at the pump.
But typical is doing a lot of work here. Across the state’s 5,890 sampled census block groups, gas consumption ranges from about 20 gallons a month in dense, transit-served parts of Arlington, to more than 100 gallons a month in rural parts of the Shenandoah Valley and the Eastern Shore.
2. Urban-Rural Divide
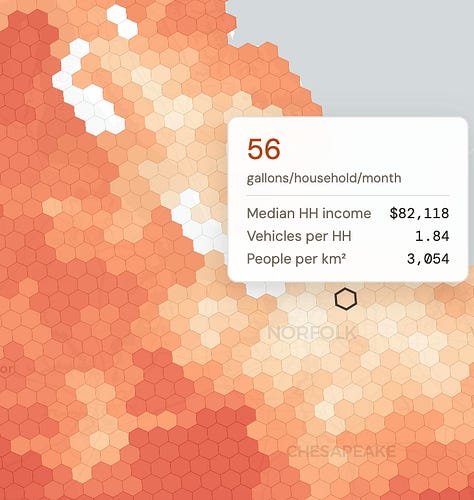
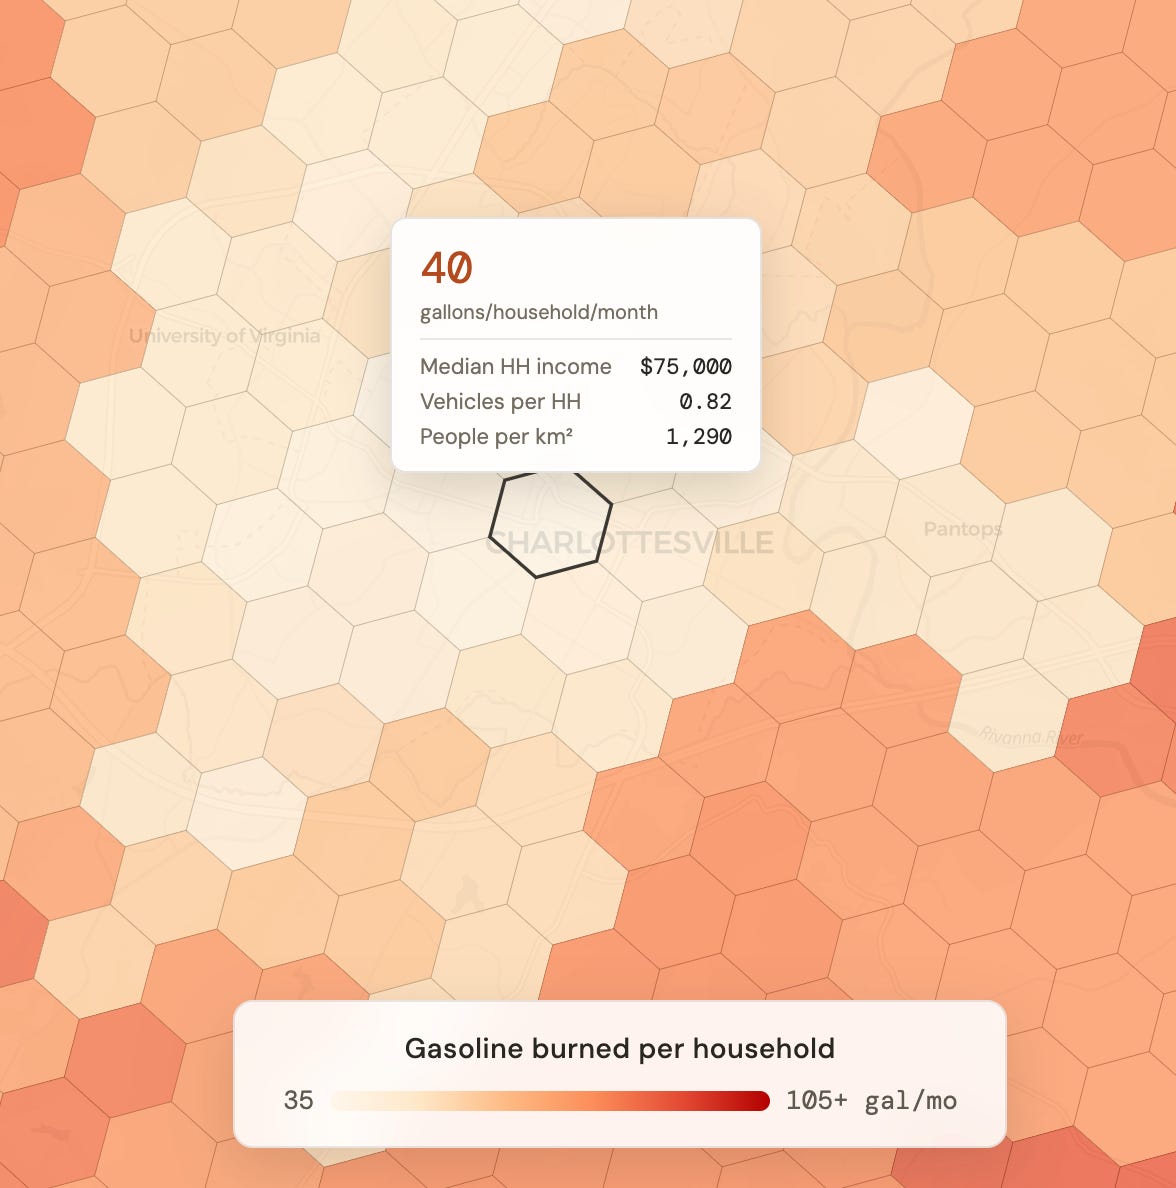
The price of oil may be uniform, but its cost to households is not. At one end of the distribution, 10% of Virginians live in neighborhoods that burn fewer than 45.5 gallons a month. These are more dense, walkable places like Arlington and Charlottesville, where a household spends roughly $2,300 a year on gas.
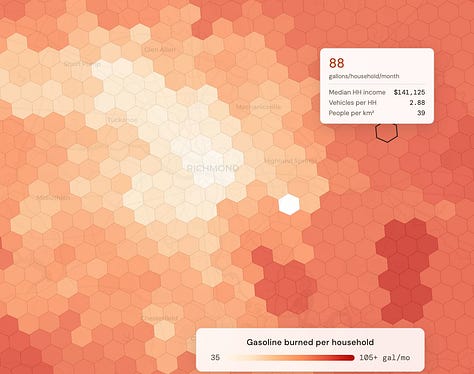
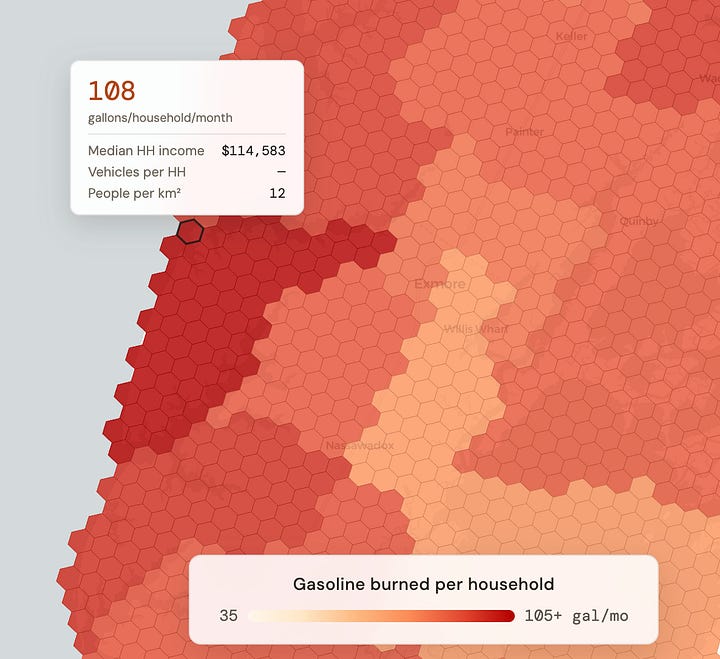
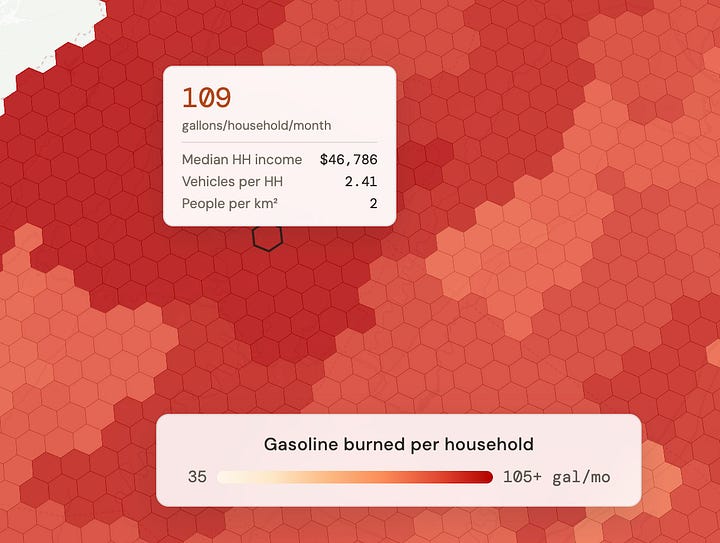
At the other end, the most car-dependent neighborhoods burn more than 88 gallons a month. These are rural and exurban places where nearly every trip requires a car. Those households spend closer to $4,500 a year. At today’s prices, the gap between these two Virginias is around $2,100 a year.
3. Household Income
It is tempting to read a map of gasoline consumption as a map of poverty, but given Virginia’s built environment that doesn’t quite work.
Across Virginia’s income quintiles, gas consumption is almost completely flat. The poorest fifth of households burn 66 gallons a month. The richest fifth burn 61 gallons.
Statistically, income explains only about 3% of the variation in how much gasoline Virginia households consume.
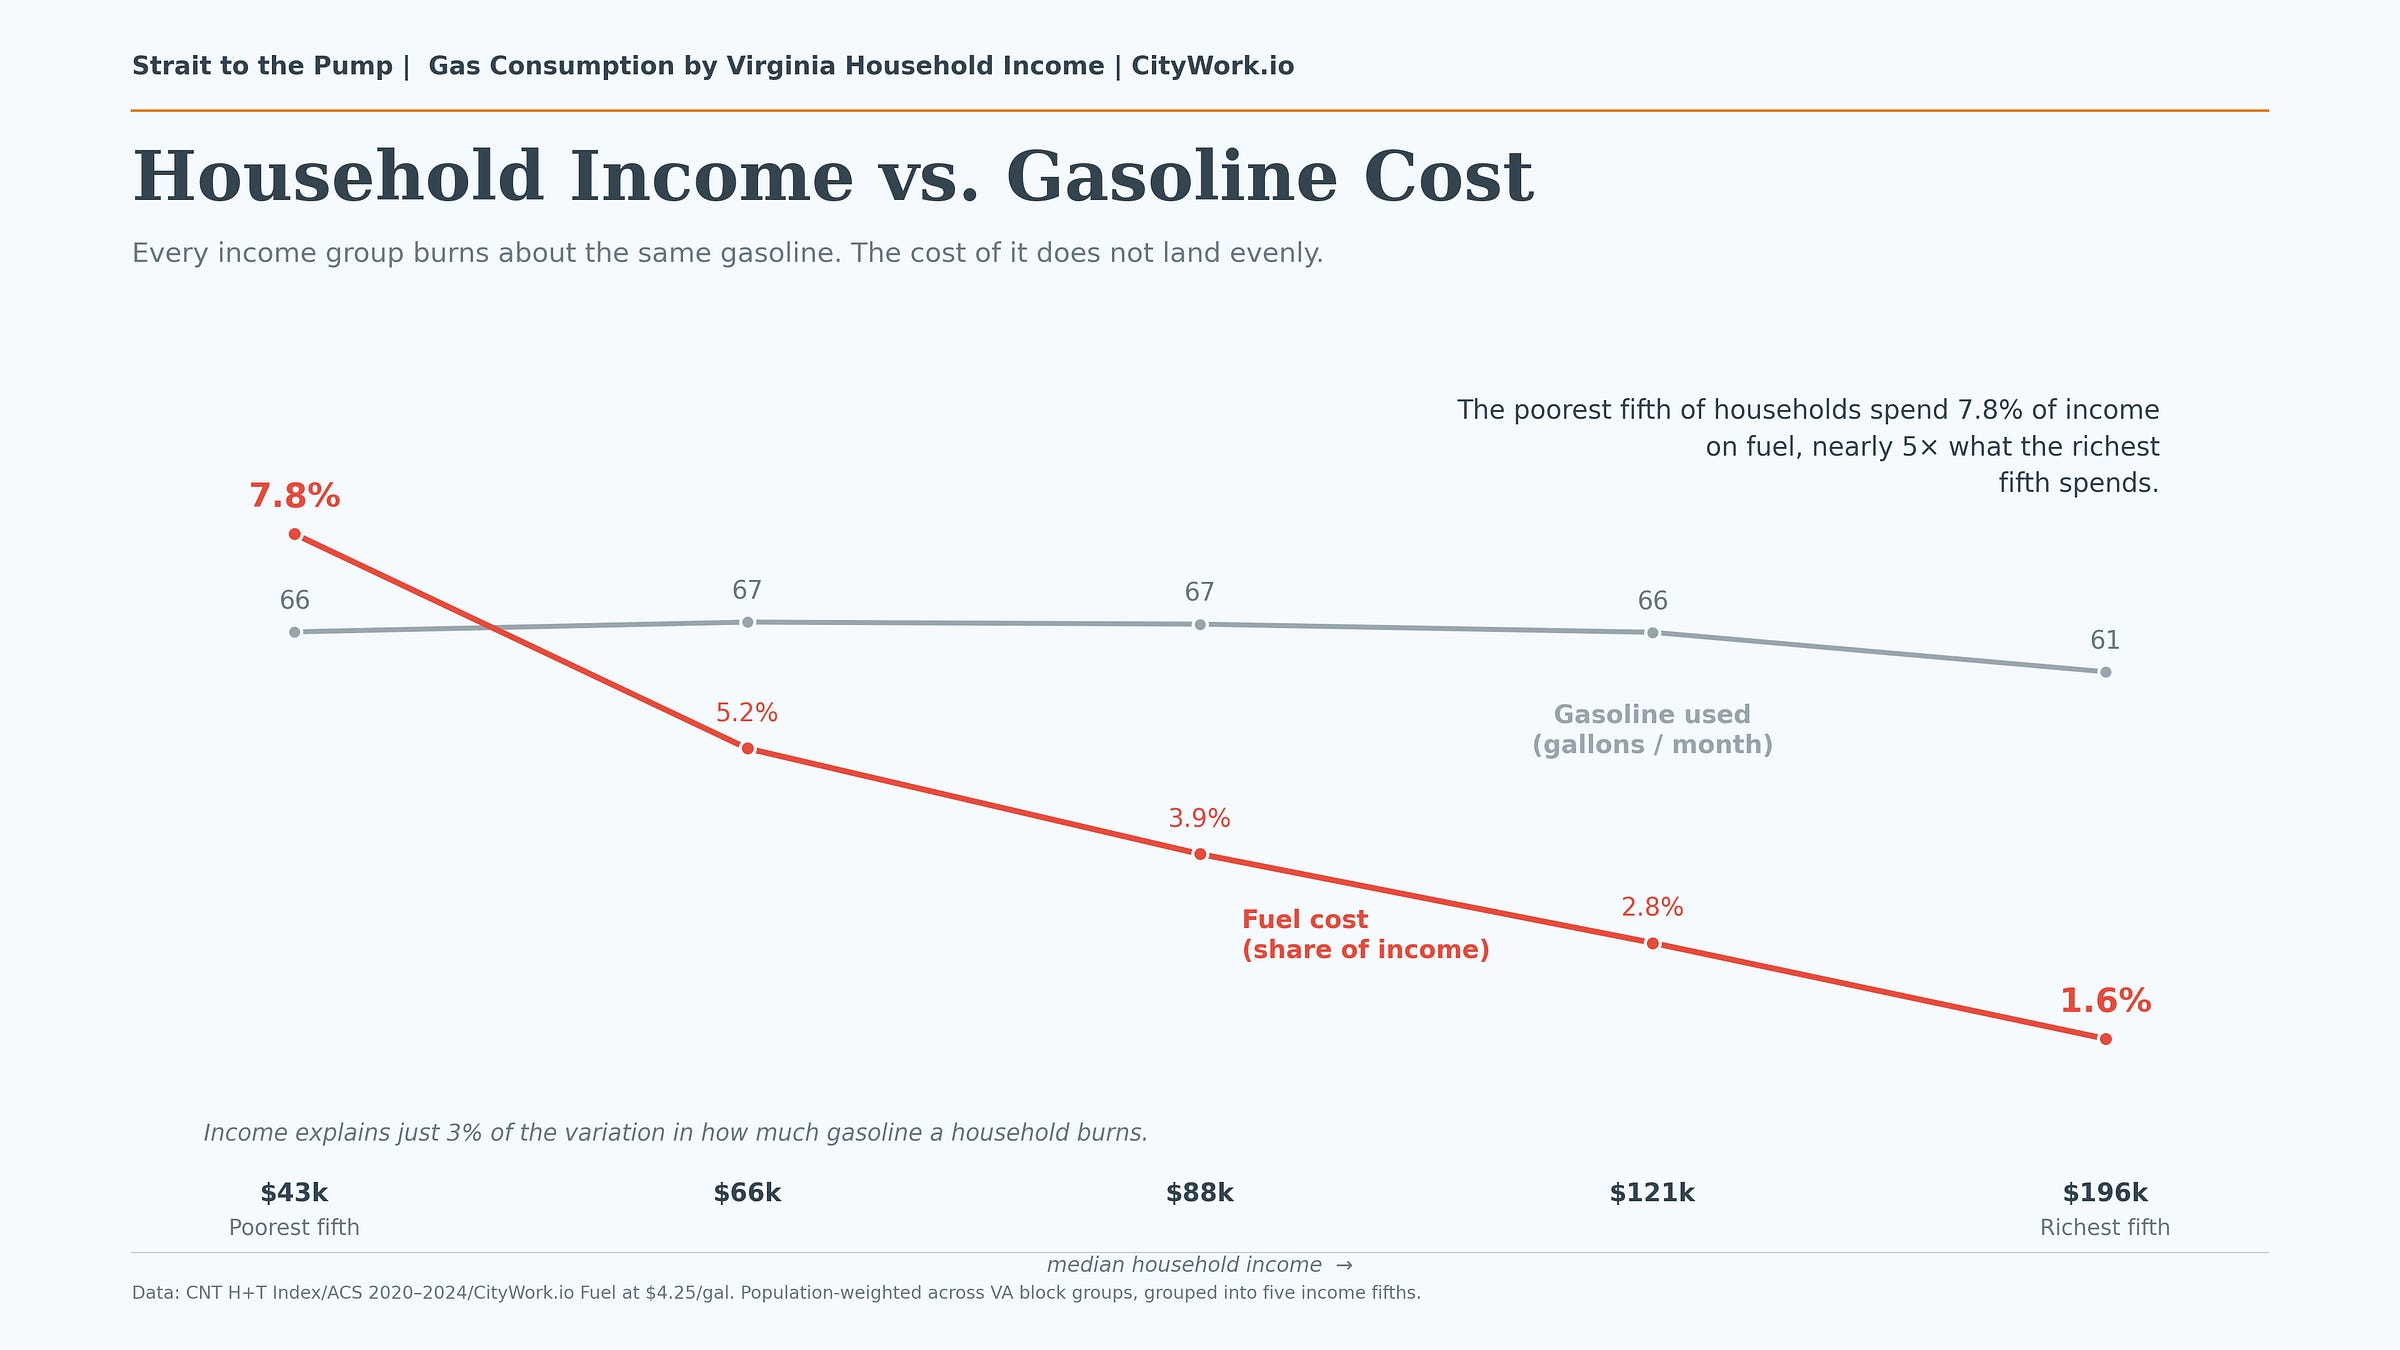
That said, just because households use roughly the same amount of gas does not mean the burden of rising prices impacts them evenly.
At today’s gas prices, fuel costs the poorest fifth of Virginia households 7.8 percent of their income. It costs the richest fifth 1.6 percent. The same tank of gas claims nearly five times more of a low-income household’s budget than a high-income household’s budget.
Some low-income households may feel pain at the pump less because they live in denser places or depend on transit. Others, especially in rural and exurban areas, have no such cushion. They have to buy gas because the labor market has been built around a car-first society.
4. Commuting
“Whither goest thou, America, in thy shiny car in the night?” Jack Kerouac once asked. The answer? To work. Commuting is a far stronger predictor of who has to keep buying gas, even as prices rise.
Job access, measured here as the number of jobs reachable from a census block within 45 minutes, has a strong inverse relationship with household gasoline consumption, with a correlation of r = −0.78.
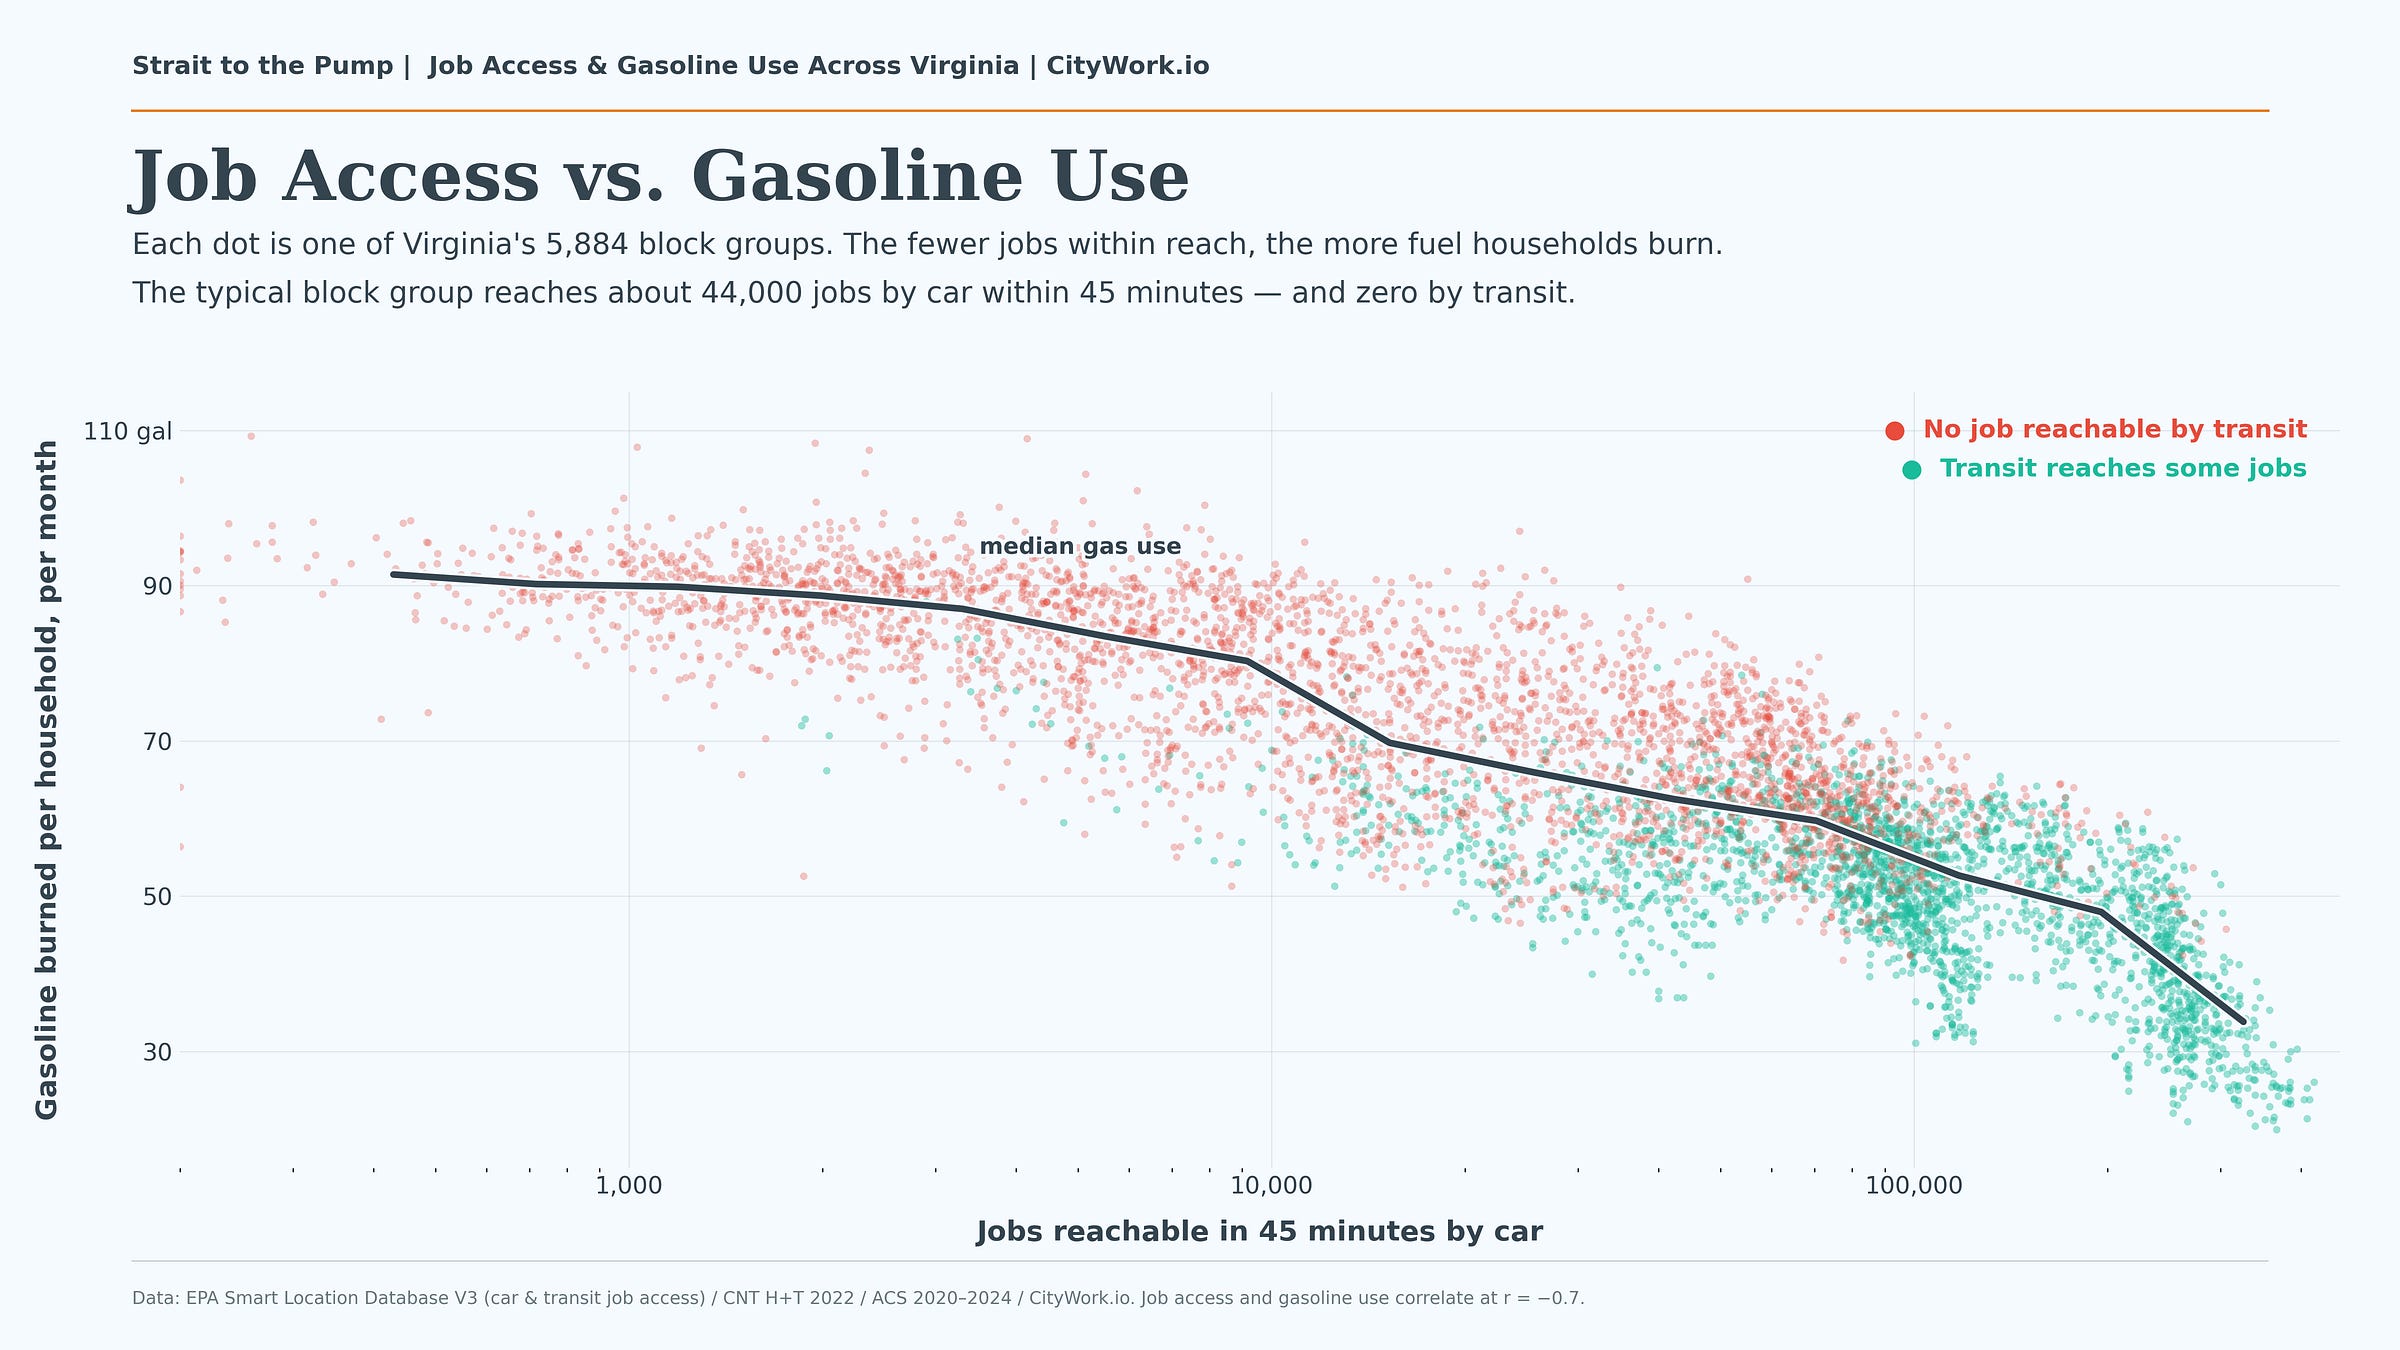
Across Virginia, households in places with the fewest reachable jobs consume the most gasoline, while households in places with the greatest access consume the least.
From the median Virginia block group, roughly 44,000 jobs are reachable within a 45-minute drive. From that same block group, zero jobs are reachable within a 45-minute public transit trip.
Put differently, more than half of Virginians live in places where a bus or train cannot get them to a single job within 45 minutes, while a car from the same doorstep can reach thousands.1
5. Burn Gaps
The struggle over public transit in Virginia, like most states, is a story of an induced political coma. But unlike most states, many of Virginia’s major cities are independent jurisdictions, nested inside (but politically severed) from the counties that surround them. And good transit tends to stop at that border.
Richmond shows the effect cleanly. The city itself has about 83,000 jobs within a 45-minute transit ride. Cross into neighboring Chesterfield or Henrico and that number drops basically to zero.
Zoom in and the role of those lines gets clearer. Albemarle County has one of the widest internal gas gaps in the state. Its least-driving neighborhoods burn about 38 gallons a month less than its heaviest, nearly two full tanks between one end of the county and the other. Charlottesville sits inside Albemarle but is governed on its own, and its gas use is far more even. About 15 gallons separate its lightest and heaviest neighborhoods.
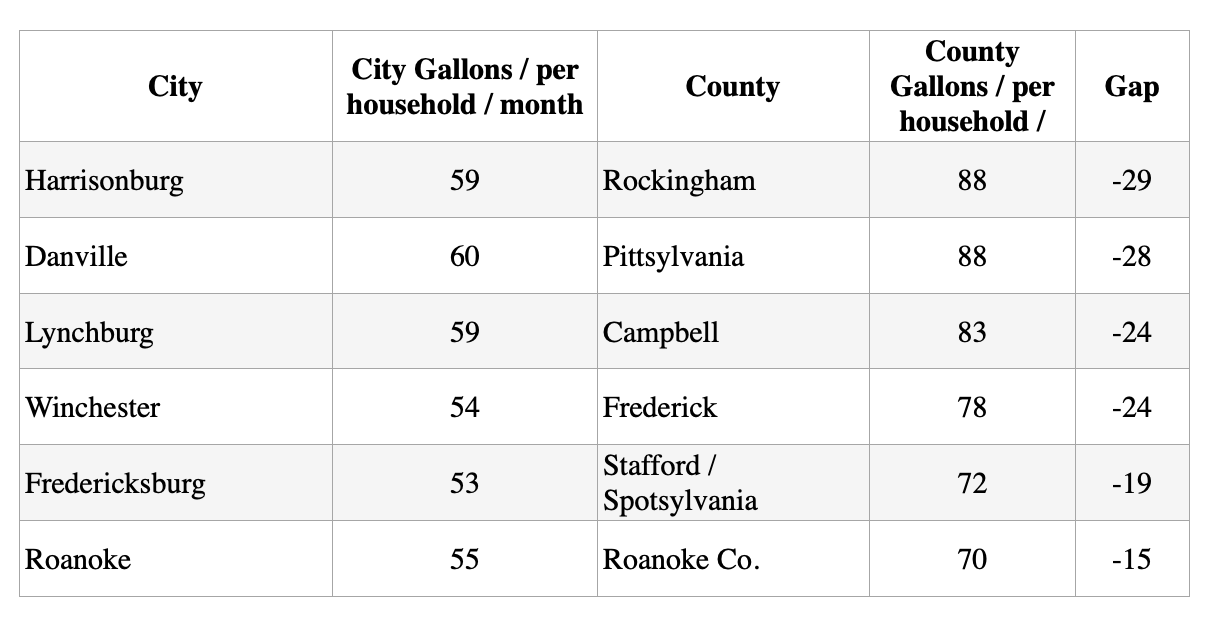
The two share the same job market and economy, what differs is that Charlottesville is a small, dense city. While Albemarle County contains everything around it, suburbs out to rural fringes, bundled under one boundary.
Where transit does reach more than zero jobs, it changes how people drive. Among households with transit options, monthly gas consumption falls from about 59 gallons in the lowest-access neighborhoods to 37.6 in the densest.
What it doesn’t do is sort by income. Rich and poor households are almost equally boxed in by the transit deserts. 57% of the top income quintile and 58% of the bottom live with no transit-accessible job. That said, the ability to afford gas disproportionately burdens low income households.
6. In the Neighborhood
What the crisis playing out in the Strait shows is how tightly local decisions about land use and transportation are tied to global politics. A barrel priced in a 21-mile channel between Iran and Oman impacts a Virginia household through a chain of choices made nowhere near the Persian Gulf. How much gas we use, where a bus stop gets placed, how far we have to drive to work — these ostensibly hyper-local questions are tethered to the wider geopolitical system. The Strait of Hormuz may be a world away from the Shenandoah Valley or the Eastern Shore, but economically, they may as well be neighbors.
1. A note on what “zero” means here. It doesn’t mean zero jobs exist. The median household in those same block groups can reach nearly 13,000 jobs by car in 45 minutes. The jobs are there. There’s just no bus or train to any of them. And while remote work has loosened the link between commuting and employment for some, the loosening is uneven. More, back-to-office mandates are tightening the link again even for those who had expanded jop options in transit deserts.